Close
CloseThe light commercial vehicle (LCV) market grew for the third consecutive month in November, with the 28,541 registrations reducing the deficit to 2019 to a smaller 21.5%. The 8.8% increase in registrations versus 2019 was driven by increases in all sectors apart from the 4×4 sector, ahead of an expected busy run up to Christmas.
The second countrywide lockdown, social distancing measures, redundancies, Brexit and possible vehicle tariffs will continue to affect LCV demand for the remainder of this year and well into 2021.
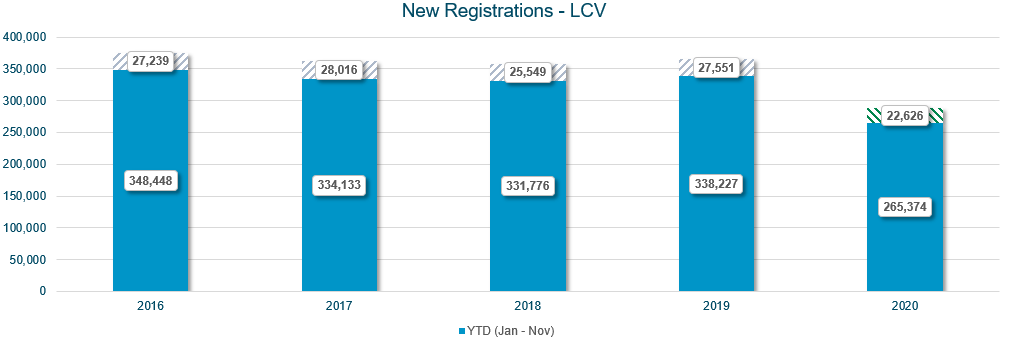
Year-to-date registrations to the end of November stand at 265,374 units compared to 338,227 units in 2019. Breaking the month down by sectors reveals that registrations for vans under 2.0 tonnes, vans between 2.0-2.5 tonnes and vans between 2.5-3.5 tonnes increased by 13.7%, 13.6% and 25.2% respectively. Turbulent times for the Pickup sector continue as registrations declined again, this time by an alarming 56.2%.
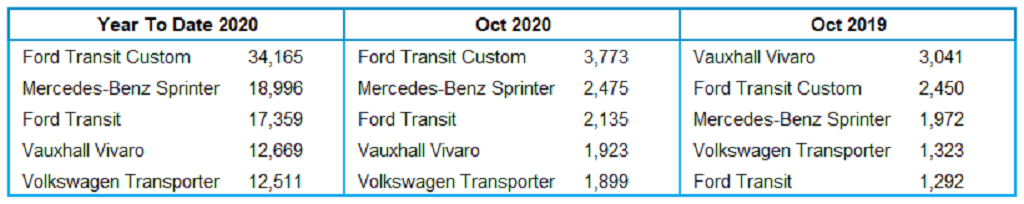
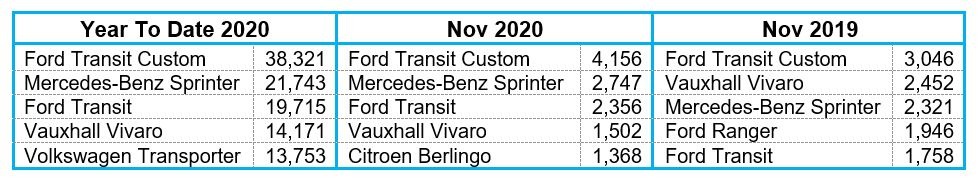
Top five LCV registrations
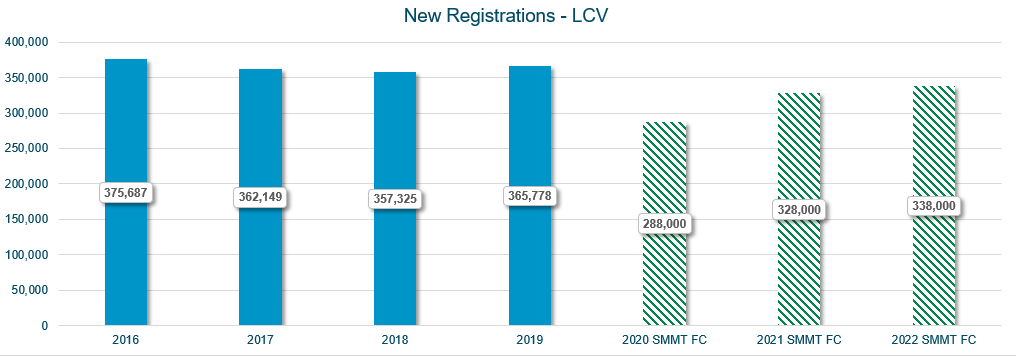
The quarter four SMMT LCV registration forecast for 2020 has been issued, revealing an increase of 6.6% to 288,000 units. With a current shortfall of just over 22,600 units, the new prediction would seem achieveable with one months registrations to account for. Historically, December would be recognised as a quieter month, but with many operators eager to purchase new stock before any further lockdowns or potential Brexit tariffs are imposed, it is likely to be a busy month.
At the end of November, UK registrations remained 72,853 units down on the same point last year. The stop start nature of the pandemic restrictions has, and continues to affect many businesses. Although the rise in registrations over the last three months has been a welcome boost to the economy, the final registration total is still likely to be in the region of 45,000-50,000 units short of last year.
The interconnected nature of the UK economy means that there should be caution as the country emerges from the latest lockdown. With Brexit still undecided, the strong performance of the last three months should not be taken as an improving trend. The coming months will bring opportunities and challenges in equal measure.
November Used Light Commercial Vehicle (LCV) Overview
Performance in the LCV auction market remained strong in November despite the second lockdown in England. High bids continued for retail-ready stock with a lack of quality fuelling demand in the busy home delivery run up to Christmas. Traders and dealers are now adept at utilising online tools proactively, changing the emphasis between physical and digital activity at regular intervals. Traders are now offering ‘flexi-deals’ on their stock in an effort to attract new business and to maximise profit opportunities.
The limited volumes of new stock available, leasing companies have also been looking at alternative revenue streams, with many now incentivising existing customers to extend their current contract on much cheaper rentals.
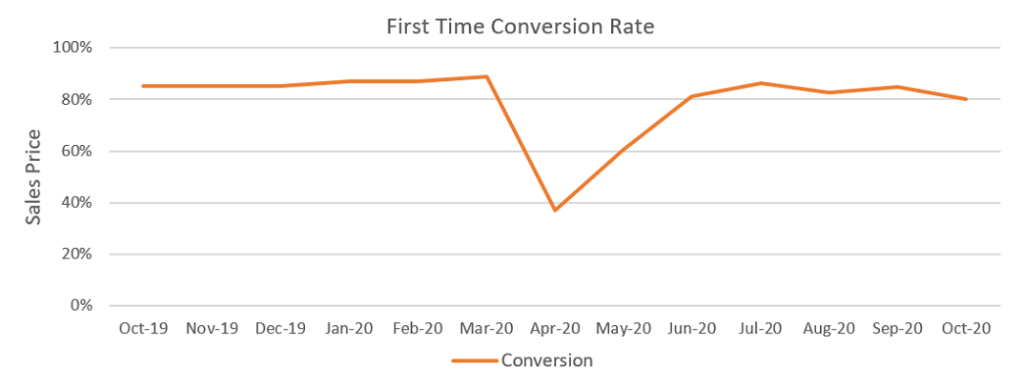
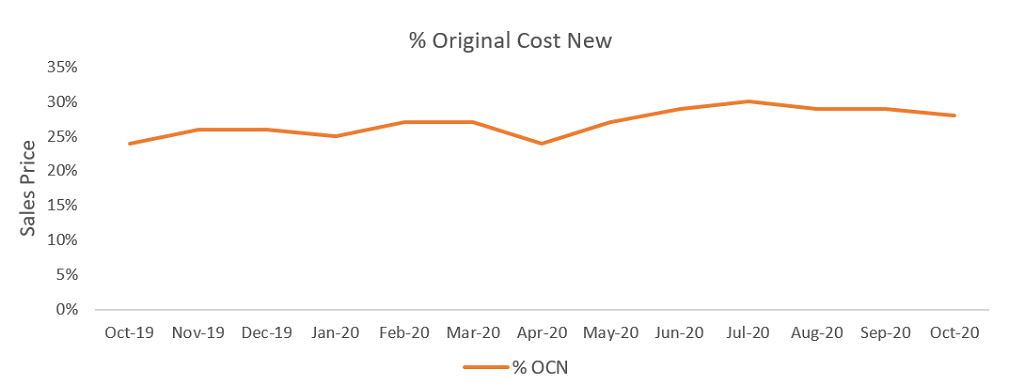
The sustained appetite for retail-ready stock shows no sign of fading. Auction houses reported that Euro 6 stock made up over 35% of all LCVs sold at auction during the disrupted month of November, with an 88.0% first-time conversion rate. Many of these units supported the move to home shopping during the pandemic together with the increase in deliveries in the run-up towards Christmas.
The outlook is for prices to remain high as demand for essential services such as food; medicines, courier and construction remain strong.
November in detail
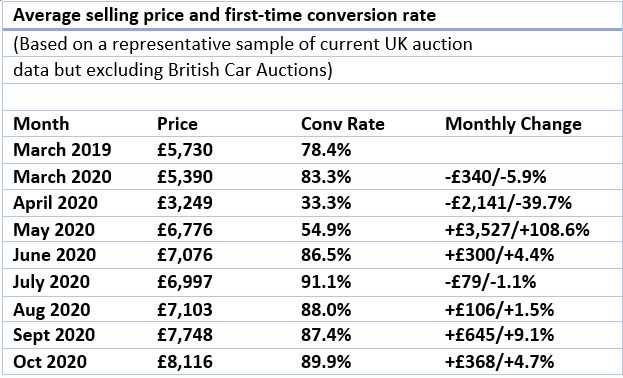
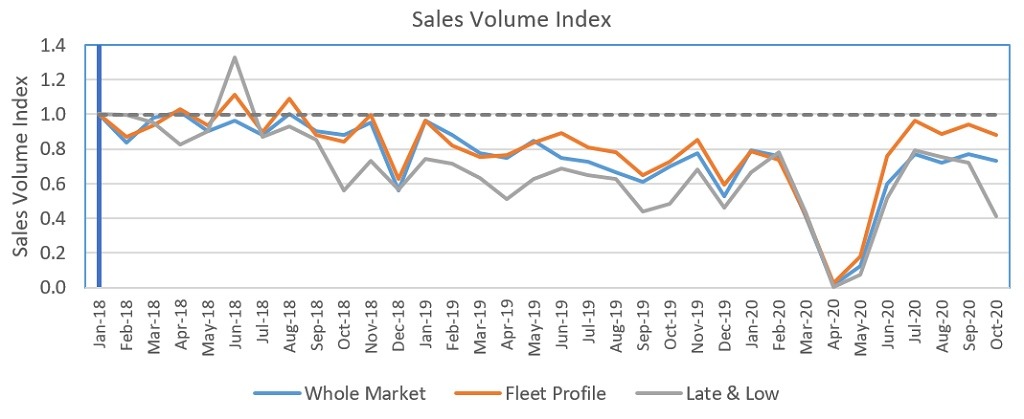
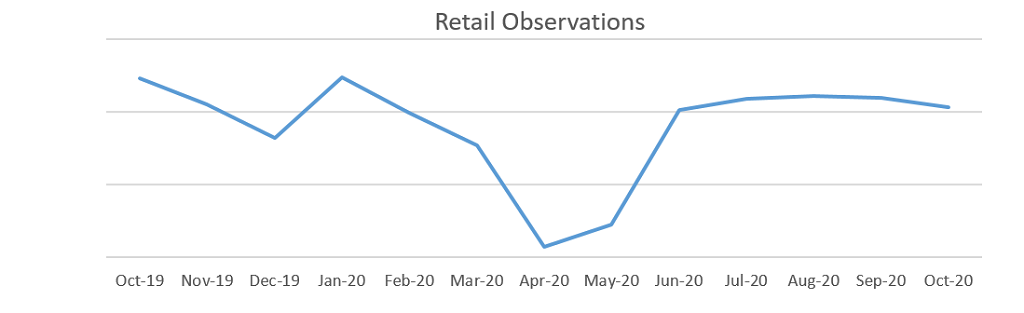
Glass’s auction data results show the overall number of LCV sales in November declined by 17.9% versus October 2020 and 10.0% over the last twelve-months. First-time conversion decreased 1.2% overall, with the 4×4 sector most heavily affected. Nevertheless, a healthy 88.7% first time conversion rate was up 4.0% versus November 2019.
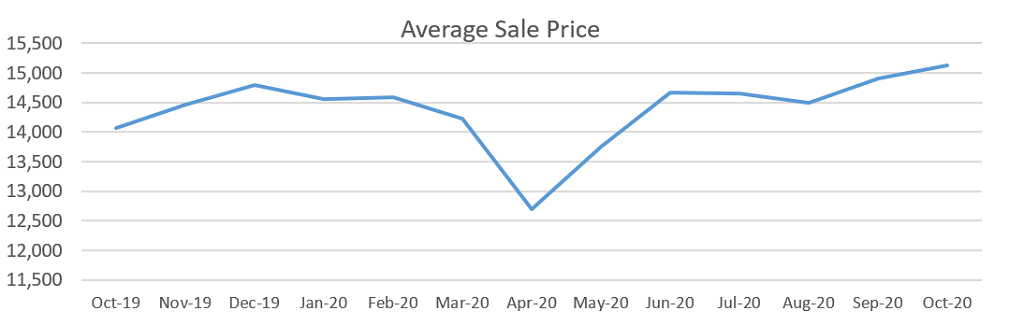
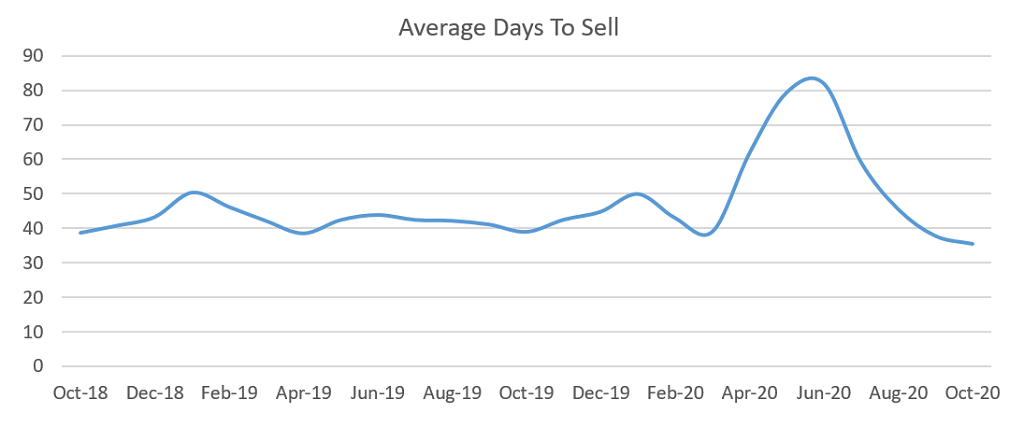
The lockdown month of November saw average sales prices decline by 9.5% versus October, but were still 30.4% higher than the same point last year – the third highest in the last twelve months. The average age of sold stock rose from 72.4 months in October to 73.5 months in November, but was still 3.7 months younger than the same point last year.
In line with this older vehicle age profile, average mileages for sold vehicles increased from 73,438 miles in October to 78,205 miles in November. The November average mileage is still 4,674 miles lower than at the same point last year.
Glass’s continues to monitor the LCV market closely and has an open dialogue with auction houses, manufacturers, leasing and rental companies, independent traders and dealers as well as the main industry bodies. This information, combined with the wealth of knowledge in our CV team ensures Glass’s valuations remain relevant in the market place.