Close
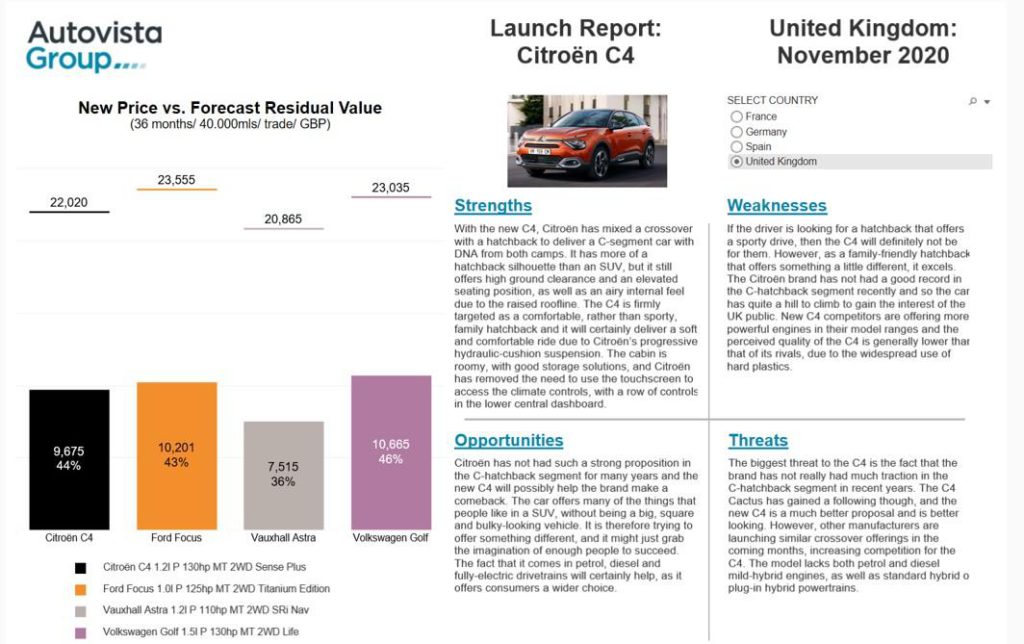
CloseWith the new C4, Citroën has mixed a crossover with a hatchback to deliver a C-segment car with DNA from both camps. It has more of a hatchback silhouette than an SUV, but it still offers high ground clearance and an elevated seating position, as well as an airy internal feel due to the raised roofline.
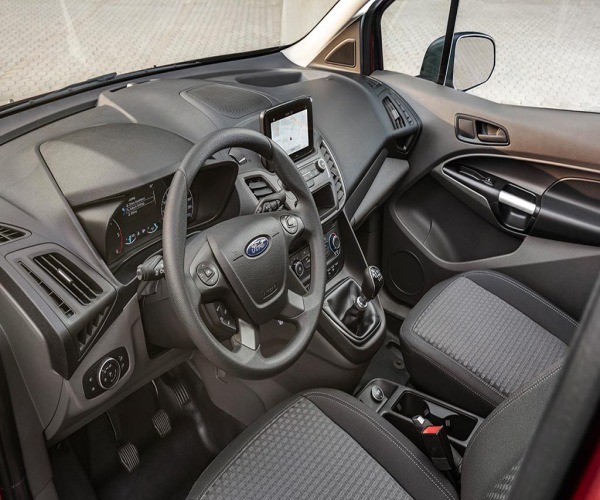
The new Citroën is equipped with progressive hydraulic shock absorbers, comfortable seats, 18-inch wheels, a digital cockpit, and offers good space between the two seat rows. It also has more than 20 advanced driver-assistance systems (ADAS), a head-up display and a 10-inch central console. Citroën has removed the need to use the touchscreen to access the climate controls, with a row of controls in the lower central dashboard.
The C4 is available with petrol and diesel engines, as well as a fully-electric version, the e-C4, on PSA’s modular, ‘multi-energy’ CMP platform. It is one of the hatchback/crossover pioneers in the C-segment and is offered at a reasonable price point, especially with the good level of equipment. However, some manufacturers are launching similar offerings in the coming months, increasing competition for the model.
Click here or on the image below to read Autovista Group’s benchmarking of the Citroën C4 in France, Germany, Spain and the UK. The interactive launch report presents new prices, forecast residual values and SWOT (strengths, weaknesses, opportunities and threats) analysis.