Close
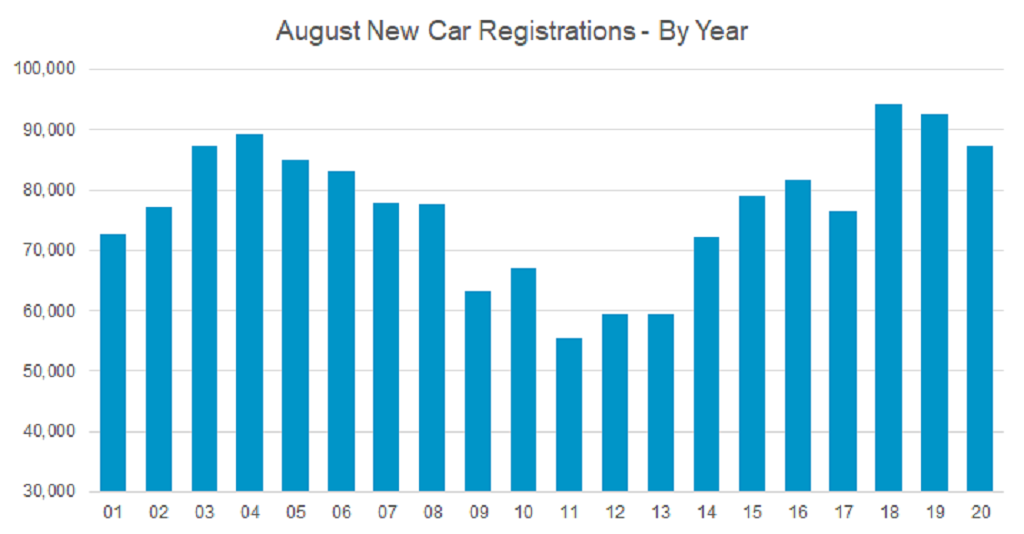
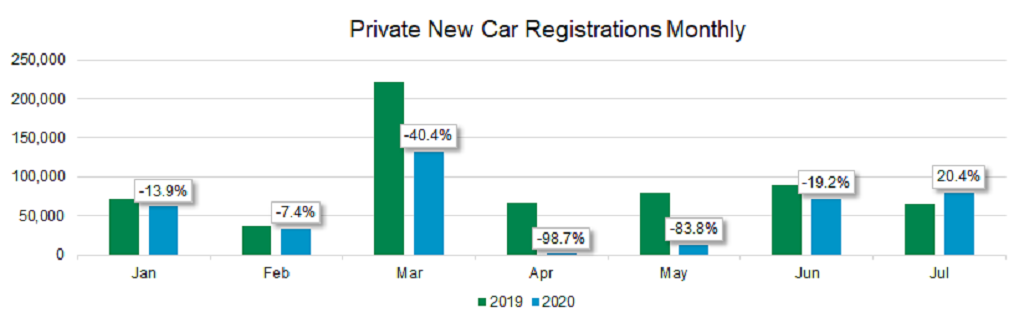
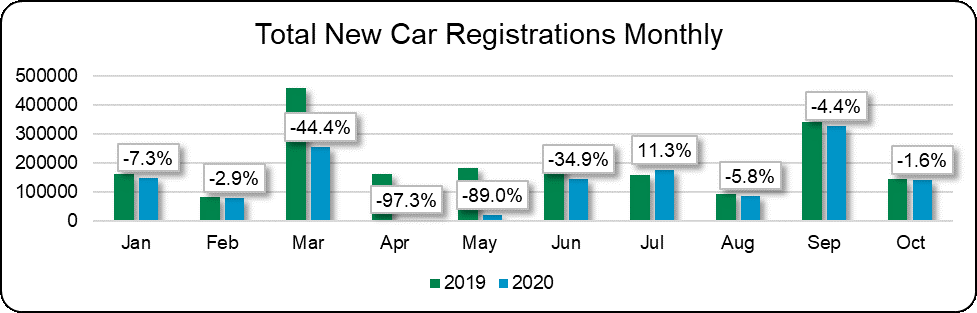
CloseFollowing September, new car registrations in October had a relatively low bar to clear to eclipse last year’s total, due to the WLTP emissions testing challenges faced in 2019. However, once again registrations failed to match last year’s figure coming in 1.6% lower at 140,945, according to the latest figures published by the Society of Motor Manufacturers and Traders (SMMT). This was the lowest October total for nine years and over 10% lower than the average October total over the last decade.
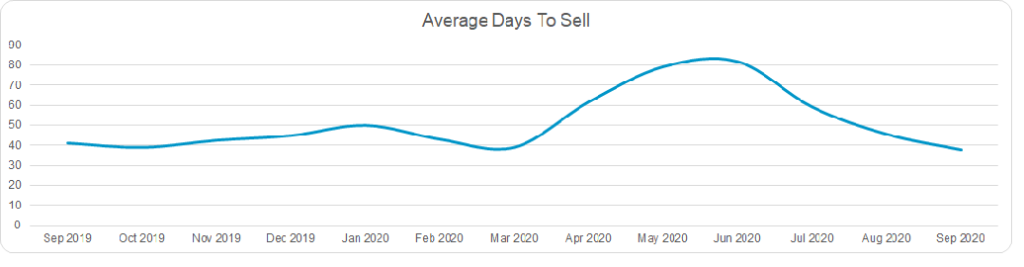
There was potential for an uptick in October, but with the Welsh lockdown towards the end of the month hitting registrations in the region by up to 25%, any momentum fizzled out. On a positive note, October was the least-worse month-on-month comparison versus 2019 (see chart below). The year to date registration total is now down 31%.
Data courtesy of SMMT
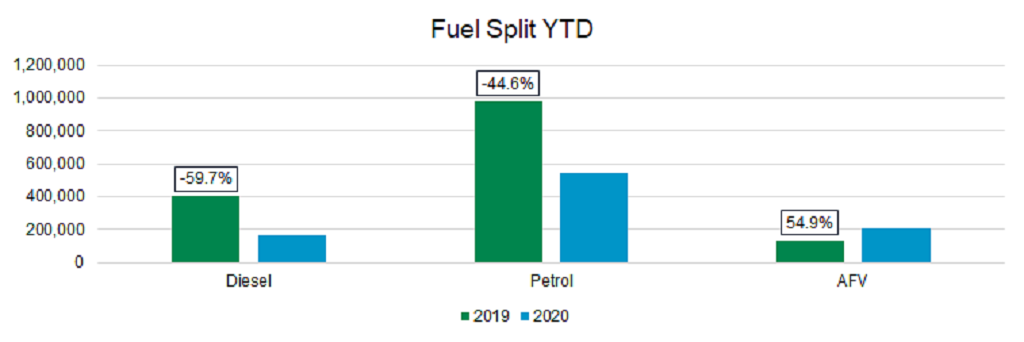
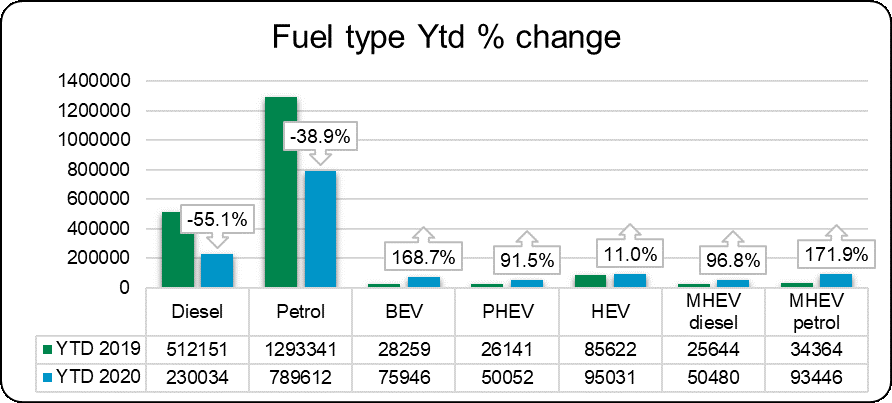
Pure petrol cars saw a 21.3% reduction while diesel fell a significant 38.4% and accounted for just 14.9% of the new car market in October. However, large increases in mild-hybrid (MHEV) models mitigate these figures as they jumped significantly compared to last October, with petrol MHEV up 545.8% and Diesel MHEV up 56.6%. This shift has played out all year as shown in the year-to-date chart below, as car manufacturers continue to reduce CO2 outputs using mild-hybrid technologies.
Data courtesy of SMMT
Despite the year’s very low total registration figure, the bright spot continues to be alternative fuel vehicles, especially Battery Electric Vehicles (BEVs). With the registration total of BEVs almost trebling in October compared to last year. The adoption of BEVs is higher in the fleet market, with 43,146 cars registered year-to-date compared to the private market at 26,682. Benefit in kind (BIK) taxation benefits and product confidence make the BEV proposition more compelling to company car users. For private retail customers, the lack of taxation savings, higher list prices (versus internal combustion engine vehicles), lack of knowledge of both longer driving ranges and the potential for the total cost of ownership savings, makes the BEV purchase proposition more difficult for private consumers with the increased upfront financial burden.