Close
CloseEurope’s big five markets all suffered double-digit declines in new-car registrations in 2020 and the magnitude of the recovery in 2021 fundamentally depends on the duration and severity of restrictions to tackle COVID-19 and the accompanying economic impact. Automotive-specific factors will also determine the extent to which markets bounce back in 2021. Senior data journalist Neil King explains Autovista Group’s key predictions for the year ahead, focusing on new-car registrations in this first part.
Despite the new-car market stability in December, Spain still contracted more than the other major European markets in 2020. This does not automatically mean it will enjoy the highest level of growth in 2021. The end of the RENOVE scrappage scheme on 31 December 2020 and higher, WLTP-based registration taxes from 1 January 2021 pulled demand forward into 2020. Furthermore, with no improvement in Spain’s crucial tourism sector, and therefore the wider economy, envisaged in the near future, new-car registrations in Spain are expected to recover at a slower rate than in the leading European markets, except Germany.
‘A very tough first half of the year is expected, and a start to the recovery in the second half of the year. In any case, the recovery will be slow, and we do not expect new-car volumes to reach figures similar to those of 2019 for at least three years,’ commented Ana Azofra, valuations and insights manager at Autovista Group in Spain.
The recovery in Germany is forecast to be rather limited, not only because it starts from the highest base, declining by only 19% in 2020, but also as new-car demand will be slightly hampered by the return to a VAT rate of 19%, up from the reduced rate of 16% that was in effect from 1 July to 3 December 2020. The smaller quantities of newly launched high-volume vehicles in 2021, and the reduction in the range of products due to the threat of CO2 fines, will also have an impact. However, regained production capacity, as well as the significantly lower availability of very young used cars, should act as positive effects. Autovista Group’s Schwacke is cautiously optimistic for 2021 and forecasts a recovery to just under 3.1 million units, equating to growth of 6%.
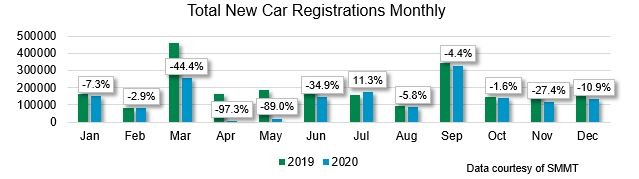
New-car registrations, major European markets, year-on-year % change, 2020
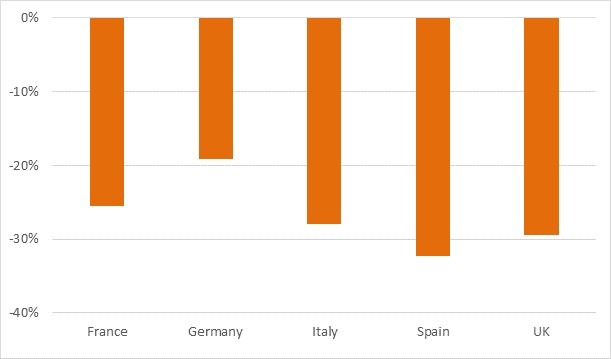
Source: CCFA, KBA, ANFIA, ANFAC, SMMT
Post-Brexit Britain, incentivised Italy
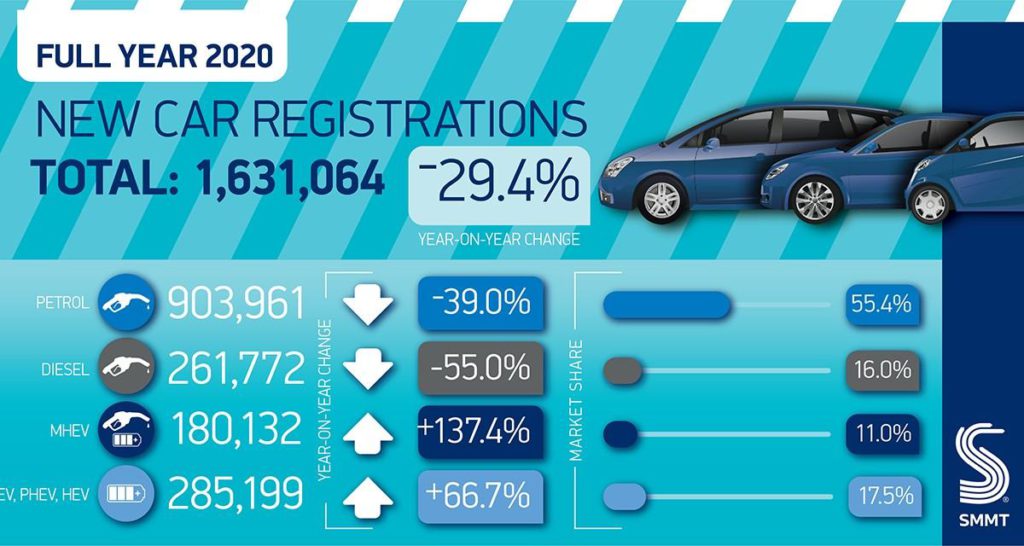
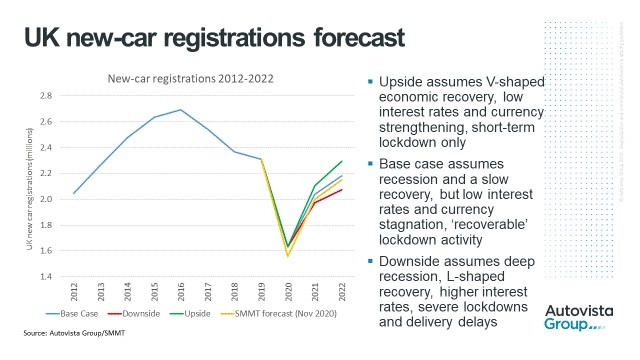
The declines in new-car registrations in Italy and the UK in 2020, were 27.9% and 29.4% respectively. However, new-purchase incentives introduced in Italy and the end to Brexit uncertainty in the UK, which compounded the effects of COVID-19, will provide a positive impetus to demand in 2021.
Autovista Group’s latest base-case forecast predicts a 25% improvement in UK new-car registrations in 2021, to just over two million units. However, this is predicated upon vehicle deliveries being largely unimpaired by post-Brexit disruption after any short-term teething problems, and the car market being able to recover from the current lockdown, together with any further restrictions that may be imposed later in the year.
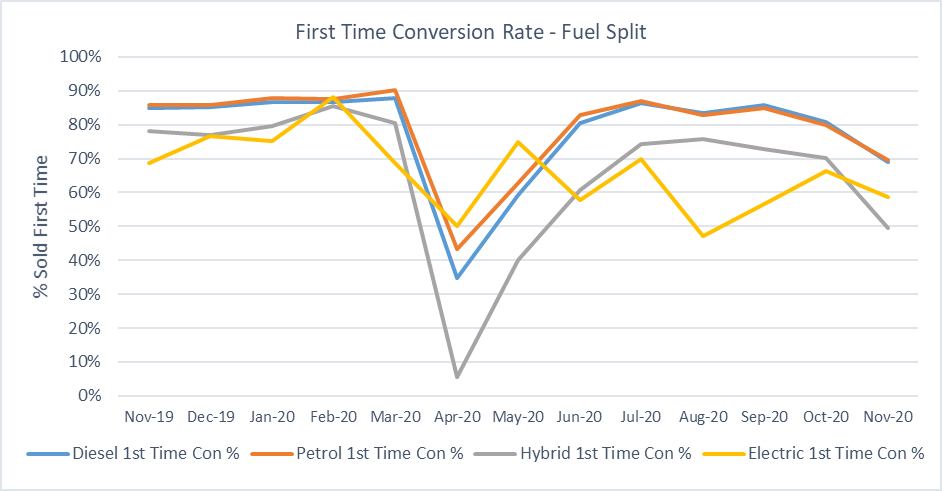
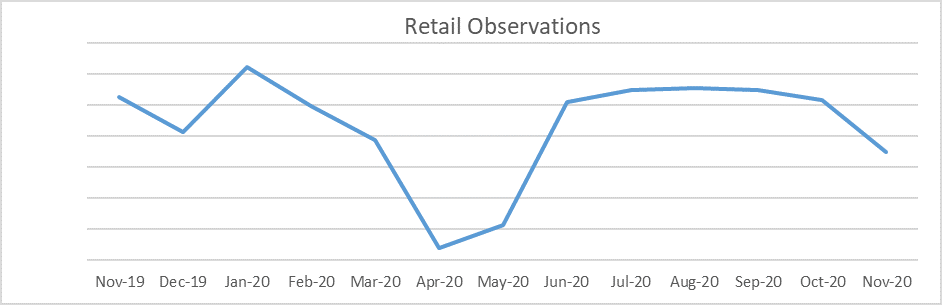
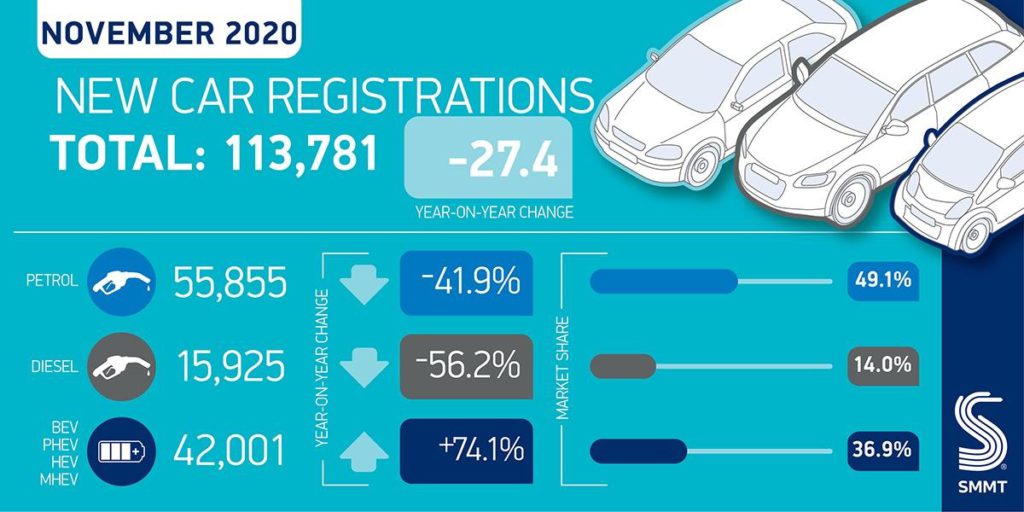
‘Import delays at the port of entry will reduce UK registrations in Q1 and Q2 2021 and manufacturers are still not producing cars at full capacity due to COVID-19. The UK is also in lockdown but click-and-collect will help some car registrations, with the November 2020 volumes highlighting the need retail customers still have to kick tyres,’ said Anthony Machin, head of content and product at Glass’s.
The recovery is not expected to be as pronounced in Italy, but the new incentives will certainly help to drive the recovery.
Fuelling France
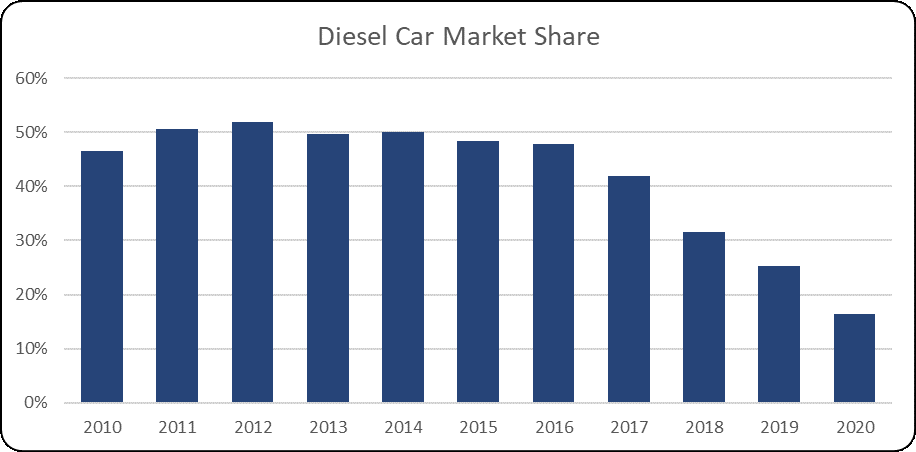
The French new-car market contracted slightly less than Italy and the UK in 2020, by 25.5%. In addition to the COVID-19 effect, the market was impacted by tax changes that were introduced in March 2020 and especially penalise petrol cars. These negative influences should dissipate during 2021 but the reduction in incentives for electrically-chargeable vehicles (EV) and the threshold for the environmental ‘malus’ (penalty), along with a higher penalty ceiling, will suppress demand.
‘Despite a more favourable malus scheme for diesel cars on the new-car market, I do not expect a diesel sales increase in 2021 and I expect lower petrol sales. However, OEMs are pushing battery-electric vehicles (BEVs) on the new-car market for CO2 reasons and the number of plug-in hybrids (PHEVs) increased a lot in 2020, a rise that will continue in 2021. Hybrids also offer a real alternative to petrol cars as they are cheaper than PHEVs, the electricity usage is simpler and, in terms of taxation, they offer the same benefits,’ explained Yoann Taitz, Autovista Group head of valuations and insights, France and Benelux.
In a follow-up article, King will discuss Autovista Group’s predictions for used-car demand and residual values in Europe’s major markets in 2021.