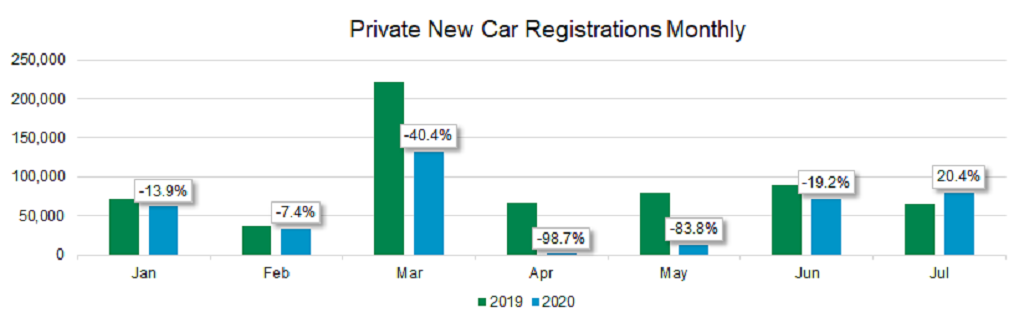
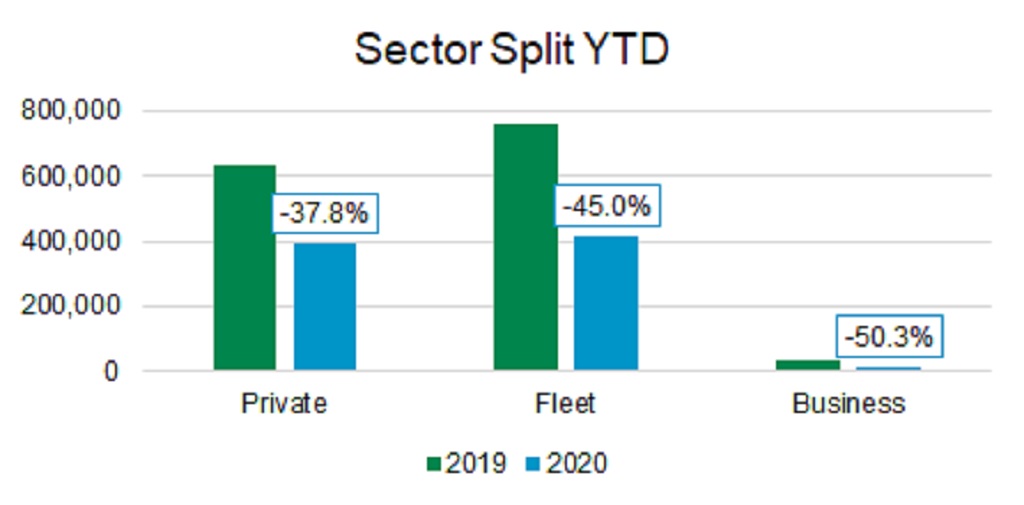
Fuel Type: benzin

Car Market Overview September 2020

According to registration figures released by the SMMT, the UK’s new car market recorded its seventh monthly decline in August with a 5.8% reduction compared to last year. Fortunately, as August tends to be a low volume month, the reduction equates to only 5,347 units. Year to date, total registrations now sit 39.7% lower than 2019 at 915,615 cars.

There is little prospect of clawing back lost ground due to lockdown. However, September’s plate change could offer some good news if the new ’70-plate’ produces a bumper registration haul and exceeds last year’s total. There are suggestions from the industry that if new car stock allowed, September could record the highest number of registrations ever, due to resurgent demand. This positive market sentiment is incredible for a market so severely affected during the lockdown, however, in reality, COVID-19 related production and logistical related delays will likely rule out a record September.

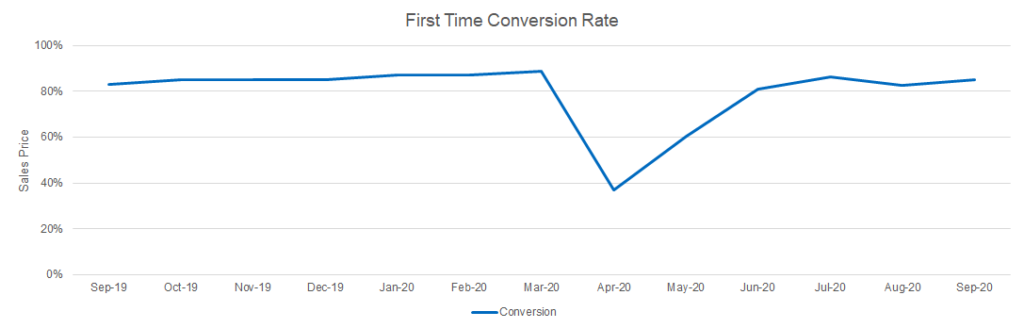
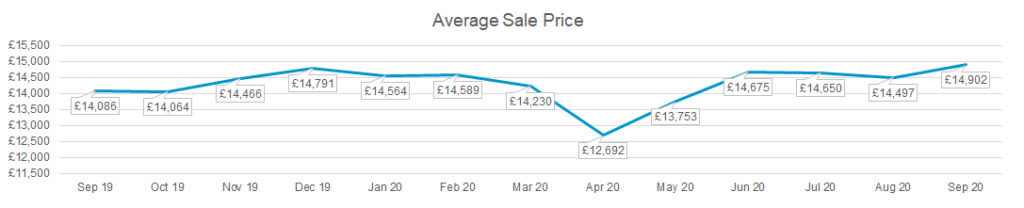
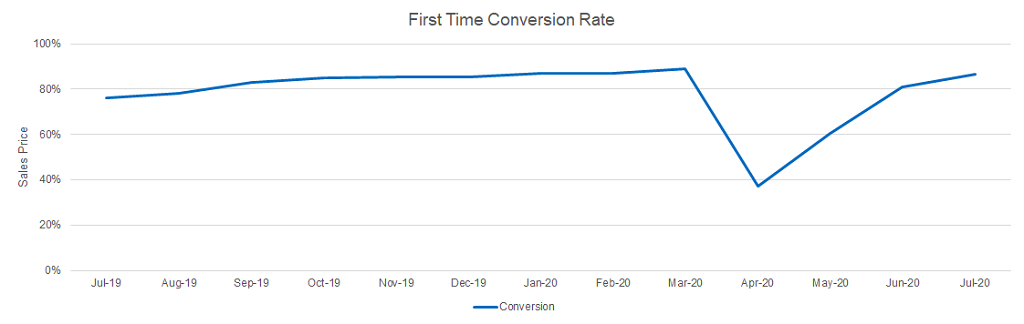
The used car market continues to outperform last year with auction activity in August remaining strong. The average first-time conversion rate was 82.8% which is almost five percentage points better than in August 2019. Hammer prices remained high in August, exceeding Glass’s Trade values by 2.3%, leading to further increases in Guide values in September. This compares to a reduction in September last year of 2%, underlying how different this year is compared to last.

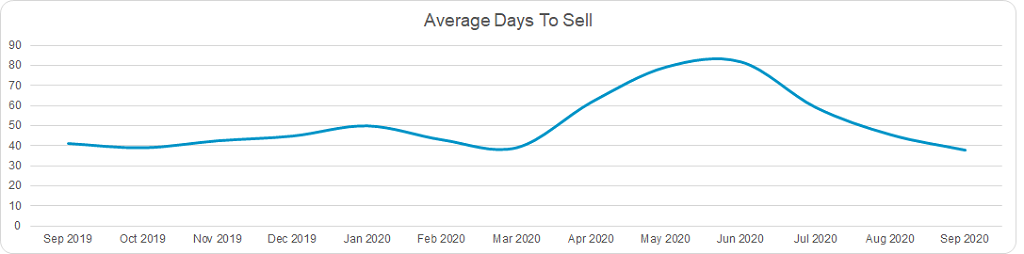
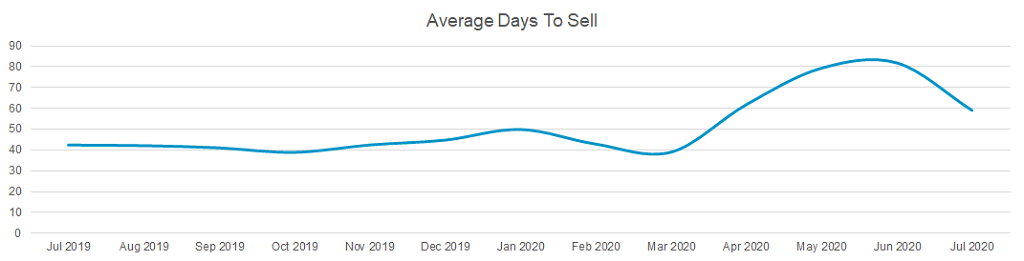
The buoyant retail market continues to underpin strong trade market conditions. Following the trend since the end of lockdown, average days to sell retail units continued to reduce in August. The average fell to 45 days down from 59 days in July and is now tracking pre-lockdown levels.

Whilst increased new car sales activity through September is expected to generate more part exchanges, it is unlikely that they will hit auction sales in volume until the back end of the month. We, therefore, expect wholesale trading conditions to remain strong throughout September.

Used Car Market Update September 2020

Auction Wholesale Market

As expected, the rate of recovery of the used car market in the UK slowed a little in August. The key metrics of First Time Conversion Rate, Percentage of Original Cost New, and Sales observations Index ended the month lower than for July, although all still performed better than in August 2019. This suggests that “normality”, or what passes for that in these strange times, is returning to the market.

First time conversion rate graph September 2020
Used car market % original cost new graph Septmeber 2020

Taken at face value, the month-on-month reductions may be thought of as a bad thing. However, as with most statistics, it is important to consider a longer-term view. Although auctions remain only online, sale volumes are higher than at the same time last year and the decline from July is minor. There is a degree of “catch up”, but as the whole market was frozen during the lockdown, there is not a particularly large build-up of unsold stock with vendors.

Cars may not have been selling during the lockdown, but at the same time, they were also not being de-fleeted or part-exchanged. The high first-time conversion rate suggests that demand is keeping up with supply. This is supported by the average percentage of original cost new showing that buyers are keen to buy and are prepared to pay good money.

Wholesaler buyer demand

Sales of SUVs and convertibles have been noticeably strong since auctions resumed, the latter helped by the excellent summer weather. One area of the market where the Glass’s Editorial team continues to monitor very closely are alternative fuelled cars, especially battery electric vehicles (BEVs) as demand for these continues to fluctuate every month.

Used Retail Market

The Used Retail Market continues to perform well. The number of observed sales has improved slightly over July but is still lagging behind the same period last year. However, like the wholesale market, the average sale price is notably higher than at the same point last year.

Used car market retail observations graph September 2020
Used car market average sale price graph September 2020

Glass’s Live Retail pricing tool also shows that the average time a car spends on the forecourt continues to decrease and is at virtually the same level as last year – 45.5 days for August 2020 compared with 42.1 days for August 2019. This measure is a good indicator of the level of used car retail demand and the rate of improvement suggests that September’s value should show further improvement.

Used car market average days to sell graph September 2020

September 2020

Despite the challenges resulting from an online-only wholesale market and socially-distanced retailing, it appears that both the wholesale and retail used car markets have largely recovered, or even improved on pre-lockdown levels. Whilst is it tempting to be enthusiastic and positive about their prospects we are still operating in very uncertain times. A second full national lockdown is highly unlikely, although not impossible. However, localised and regional lockdowns are already in use and will continue through to the end of the year, and probably into 2021.

However, there is no harm in a bit of cautious optimism. September brings the new 70-plate and September’s new car registrations may exceed those of March; another example of the way 2020 has been turned upside down by COVID 19. New car registrations generate used car activity. This means that through September, especially the latter part, there are likely to be improvements in the key metrics for both the wholesale and retail markets.

Motorcycle Market Round Up September 2020

Market Overview

Since motorcycle dealers reopened following lockdown, the market has remained busy with strong sales and enquiries throughout August. However, dealers are starting to experience quieter periods, typical in a ‘normal’ year, with August and September holidays. The Glass’s team will follow the market with interest over the final quarter of the year, as summer turns to autumn and the furlough scheme closes with the inevitability of redundancies.

As increasing numbers of employees return to work they continue to seek alternatives to public transport raising expectations that for the remainder of the year, the commuter market will remain buoyant. CBT training centres remain busy, good news for the industry’s future, with the potential of at least some new riders progressing to full licences. With the average rider age now approximately 55, this fresh interest is welcome news.   

Top Selling Models

Scooters and 125cc remain in high demand, driven by the increase in interest from commuters, however, a broad range of machines including higher priced examples continue to enjoy strong demand.

Stock

Supply continues to improve due to increased new sales generating more part exchanges. Larger dealers report having a good selection of stock and are satisfied with their stock levels, although it remains challenging sourcing quality scooters and 125cc machines. To supplement part exchanges, most dealers continue to proactively maintain stock levels to match demand.

Sales Activity

Today, the market continues to be buoyant, with autumn approaching and the furlough scheme drawing to a close, the next few months are looking increasingly uncertain. The weather in the first half of September provided excellent riding conditions, growing the chances of an extended sales season. Taking this into account and after some careful consideration, many values have been eased back for the October guide, except where trade feedback and evidence from the market place suggests further adjustments where necessary.  Exceptions to this are mopeds, scooters and commuter machines where values have been held, due to strong demand.

Motorcycle Market Round Up July 2020

Following a strong recovery in June, motorcycle registrations accelerated in July.  Motorcycle Industry Association data shows registrations grew 42% versus July 2019 with all nine categories experiencing increases. However, like last month, it was the scooter category that recorded the strongest growth.

Glass’s Leisure Vehicles Editor Paul McDonald said, “After an impressive rebound in June, registrations gathered pace in July. However, whilst this is great news for the industry, I would suggest caution moving forward as Covid-19 makes its presence felt on the economy and especially the job market”.

Engine band highest registering model July 2020

 Power BandModelRegistrations
0-50ccLexmoto ECHO 5090
51-125ccHonda PCX 125458
126-650ccRoyal Enfield Interceptor INT 650193
651-1000ccTriumph Tiger 900 GT PRO109
Over 1000ccBMW R 1250 GS Adventure207

Data courtesy of the Motorcycle Industry Association

Dealer Feedback

Sales and demand remained strong through July with reports of records being broken at some dealers. A wide variety of machines are enjoying healthy sales, although scooters and 125’s continue to be registration driving force for dealers close to larger towns and cities. However, there was some evidence of sales activity slowing towards the end of the month as school holidays commenced.

Although demand remains strong, dealers are cautious about the longer-term economic effects of Covid-19 believing the market could feel the effects in September and October when the furlough scheme ends with the inevitability of redundancies and waning consumer confidence.

New stock is an issue for some dealers as demand outstrips supply. Lead times are unknown for certain models with a backlog of orders, whilst some dealers are looking towards early 2021 for deliveries. Used stock availability also continues to be an issue and some dealers believe sales would have been stronger if they had stock to fulfil demand. This situation is improving as elevated new registrations increase part-exchange supply.

What can the industry expect moving forward?

Following a period of ‘pent up’ demand, registrations in August will probably not experience the same level of growth compared to July. However, taking into account the late starting season, activity could still be stronger than a typical August. Moving further ahead, there is a reasonable chance the commuter market will remain buoyant as people return to work, seeking a two-wheeler as a cheaper and safer alternative to public transport. However, now the UK is officially in a recession, there is a chance demand for larger ticket items could suffer as increasing anxiety about job loss hinders consumer spending.

Sales Environment

There remains a degree of market uncertainty, with furlough schemes coming to an end and redundancies inevitable.  However, given the market currently remains buoyant and the possibility of an extended season due to the delayed start, residual values will remain steady. Taking this into account and some careful consideration, the majority of values have been held for the September guide, except where trade feedback and evidence from the market suggests further adjustments.

Car Market Overview August 2020

New car sales

Manufacturers and dealers will take some comfort from the latest new car registration statistics from the Society of Motor Manufacturers and Traders (SMMT). Following a full month of trading across the UK, the new car market produced the first monthly positive result this year, being 11.3% up on July 2019, with pent-up demand finally materialising in registration numbers.

As July is not a high volume registration month, the increase has done little to impact the overall year-to-date position with the market sitting 41.9% lower than 2019 at just over 828,000 units. However, July’s result will give dealers and manufacturers some confidence that demand remains for new cars. With some attractive deals currently on offer, August should be similarly positive. However, the high-volume September plate change is the focus month for the industry, where delivering an increase versus September 2019 may prove difficult.  

Used market

With some auction providers reporting higher stock levels than last year and an increase of over 10 percentage points in the first-time conversion rate to 86.4%, it underlines the buoyancy of July’s auction market. Hammer prices were also strong, exceeding Glass’s Trade values by 3.3% on average, leading to an increase in Glass’s values in August. With auction activity and hammer prices showing signs of further growth through August, the expectation is further increases in values in September, bucking seasonal trends.

A strong retail market is driving this exceptional wholesale activity. In July the average days it took a dealer to sell a used car fell from 82 to 59 days according to Glass’s Live Retail pricing tool, rapidly returning to pre-lockdown levels (39 days in March) as fresh stock is added to forecourts.

Used Car Market Update August 2020

Auction Wholesale Market

The recovery of the UK used car auction market continued through July. The key metrics of first-time conversion rate, sale value and sale volume are returning to track with their pre-lockdown trends. However, the rate of improvement is slowing suggesting that an over-recovery, where the market overshoots and then goes through a period of decline, is becoming less likely.

Used car market first time conversion rate graph August 2020

Sale volumes have recovered to pre-lockdown levels, despite year-to-date new car registrations being down over 40% due to the lockdown. Reduced new car registrations are impacting the volume of part-exchanges generated and the number of contract hire and lease de-fleets.

With the major auction groups continuing to hold only online sales, some buyers continue to be wary about spending substantial amounts of money on vehicles they have seen in person. However, this trust continues to improve as buyers become more accepting of the descriptions provided by the auction houses.

With traditional physical auctions unlikely to return before the end of the year, all buyers are going to have to adjust to the new way of sourcing stock. Whilst there are some challenges around online auctions, there are also advantages – particularly the ability to visit several auctions all over the country in one day rather than spending several hours in the day travelling to one or two physical sites.

Used Retail Market

The used car retail market is showing similar recovery behaviour to the wholesale market. The key measures – Average Sale Price and Days-to-Sell are both positive. Just like the auction market, their rate of recovery is slowing, suggesting they are approaching their natural level.

Used car market average sales price graph August 2020

Glass’s Live Retail pricing tool reports on the average time a car spends on the forecourt, with lower days to sell indicating higher retail demand. The average for July of 59.1 days is still 30% higher than expected, but in the circumstances is a distinct improvement over June’s average of 81.9 days. If the decreases continue over the coming weeks the value for August will be similar to August 2019.

Used car market average days to sell graph August 2020

Next Month

The trends of the key metrics for both the wholesale and retail markets continue to be positive. The rates of improvement are slowing, reducing the spectre of a “boom and bust” recovery and show trading is likely to return to seasonal levels within a few months. September will see the launch of the 70 plate generating more used car volume and activity, although typically the effect of this will not be seen until the latter part of the month.

Overall, registrations in September could exceed those for March, showing how “back to front” this year’s car market has been compared to typical seasonal activity.  The new car market is still catching up, however, Glass’s data suggests that total registrations for 2020 will be around 30% lower than in 2019.

New Car Market Update August 2020

At last there is some positivity to report in the new car market, with July registrations recording the first increase of the year. Registrations came in at 174,887, which represents an 11.3% rise on the same month last year, according to figures released by the SMMT. This was the strongest July performance since 2016.

Although fleet registrations accounted for the lion’s share of the market (52.5%), it was private registrations that demonstrated the most growth, with a 20.4% increase. Dealers being open for business for the whole month of July will have helped fulfil the pre-order backlog caused by the COVID-19 lockdown, together with improvements in the supply chain. There is also some pent-up demand generated by consumers who managed to save throughout lockdown, and are taking advantage of some competitive offers and incentives from manufacturers and dealers.

Private new car registrations monthly graph August 2020

Data courtesy of SMMT

Growth was weaker in the fleet sector, with a 5.2% improvement on this time last year to 91,857 units, as both longer term and short cycle business struggles to pick up. At the same time, coronavirus uncertainty continues to hamper business expenditure decision making, and working practices for their employees, which may affect leasing deals going forward.  Although, if there is continued improvement in the economy, back to something like pre-lockdown levels, then expect to see a strong new car order book as confidence improves and lease deals currently being extended end.

New car market sector split YTD graph August 2020

Alternative fuel cars (AFVs) are still gaining market share at a fast pace, with battery electric vehicles (BEVs) up 259.4% and Plug-in hybrids (PHEV) gaining 320.3% compared to July last year. BEVs now make up nearly 5% of this year’s total new car registrations compared to only 1.4% last year, while all other AFVs are also increasing market share, albeit to a slightly lesser extent.

The best sellers list has returned to some sort of normality this month, with small to medium sized cars filling the majority of the top ten as deliveries get back up to speed. The Vauxhall Corsa, Ford Fiesta and Ford Focus fill the top three places respectively. Volkswagen has three entrants, the Golf, Polo and Tiguan. The Mercedes A-Class, the Nissan Qashqai, Ford Kuga and MINI also feature.

August is usually a quiet month for new registrations with summer holidays in full swing, but with getaways curtailed this year, a similar monthly registration increase could be possible and would be beneficial but not crucial to the industry. The acid test will be the September 70-plate change. This is ordinarily the second most important month of the year and therefore a healthy increase in registrations would certainly go some way to keep the recovery on track.

The Convertible Market

At a time when more and more SUVs are launched, a car without a roof was once the norm, as all cars were built without any roof or sides. This was quite often to reduce weight and ensure horseless carriages could maintain forward momentum due to a lack of power. As available engine power increased, roofs and sides were added to cars.

Production of convertibles increased again after the World War II as a result of American soldiers in France and the UK experiencing small roadster cars not available in the United States. These roadsters included the MG Midget and Triumph Roadster. To compete through the 1950s and 1960s, and service the demand of returning GIs, car manufacturers in the United States manufactured a broad range of convertible models during the 1950s and 1960s.

During the 1970s, the popularity of convertibles was severely reduced by the increased speeds on roads and new crash safety standards, However, this did not stop manufactures producing new convertibles for global markets including the Triumph Stagg, TR6 and TR7, Lotus Elan and Seven S4, Alfa Romeo Spider, Chevrolet Corvette C3, MGB, Porsche 914, Fiat 124 Spider, Morgan 4/4 and Volkswagen Beetle convertible.

Reinvigorating the segment

In 1989, Mazda launched the Mazda MX-5. Over the years this has become the best-selling convertible with over 1 million units sold and creating something of a gold rush in the development of new convertibles. From humble Ford Escorts to luxurious Rolls Royce Dawns, the majority of manufacturers have marketed a convertible during their history.

The contraction

Today, demand in the new market for convertibles is waning once more. The SMMT’s registration data shows registrations falling consistently. As a percentage of the total market, convertibles stood at 4.4% in 2007 and by 2019 had fallen to just 1.6%. 

Convertible percentage of market yearly graph

The debate today, is whether we have fallen out of love with the convertible with too many products no longer evoking dreams of open top sports cars unabated by traffic congestion and variable speed limits.

During the early 2000s, manufacturers developed folding solid roof structures as the answer to the many negatives of the soft-top design, especially road and wind noise together with safety and security. Unfortunately potential buyers were not impressed in the long run by these new seemingly practical introductions. Although solving some issues, they created particularly impractical vehicles when the roof was down due to the roof occupying the majority of the boot.

The future of convertibles

Convertibles in the UK are becoming niche. Over the last 14 years SMMT data shows the convertible segment is no longer a high volume selling segment. Volumes are falling significantly, from over 104,000 registrations in 2007 to under 36,193 in 2019. The 2020 year to date figure is significantly affected by the Covid-19 Lockdown.

Convertible registrations yearly graph 2006-2020

Residual values

Over the last 7 years, the overall trend for convertible residual values (RV) has been rising. From 2013 to 2020, RVs have risen by 7.2 percentage points for models up to two years old. The up to five years old models are up by 4.6 percentage points and a notable 5.3 percentage points increase for models eight years and older. Clearly as volumes in the used market decline, residual values are becoming stronger. Moreover, the last 12 months shows a greater level of increase than would normally be expected in this short period suggesting, at least in the used market, there is still demand for convertibles. 

Convertible RVs (standard mileage) yearly graph 2006-2020

In the past year, models up to two years old have increased 1.8 percentage points, up to five years old declined 0.1 percentage points whilst models over eight years increased 2.5 percentage points. These are exceptionally strong increases, especially considering when the data was drilled down to see that nearly all the increases have been in the last three months.

Coming out of lockdown, logic might suggest the last thing on people’s minds would be buying a convertible. However, lockdown has created a pent up demand for all things fun and enjoyable, with the need to enjoy the remainder of the summer sun now more desirable than ever. Lockdown has, for some, created a greater feeling of living for today. However a significant improvement in new convertible registrations is not likely in the short term.

Motorcycle Market Round Up June 2020

Registrations in April suffered a substantial decline of 83.5%, due to the UK being in lockdown in the wake of Covid-19. During May, however, the government began the process of easing restrictions, albeit very gradually. Registrations in May experienced less of a dramatic decline. Figures from the Motorcycle Industry Association (MCIA) showed registrations 50.4% behind last year, with all segments declining.

Glass’s Leisure Vehicles Editor Paul McDonald said, “With the country in lockdown throughout May and dealerships remaining closed, another significant decline in registrations was expected.  As dealers in England began to reopen their doors on June 1st, activity has strengthened, so the forecast for June is much more positive.”

May top sellers

  • Yamaha NMAX took the lead
  • Lexmoto LXR125 was runner up
  • BMW R1250 GS Adventure remains in the top ten
  • Kawasaki Ninja 1000 SX continues its popularity

Dealer and manufacturer feedback

Indications from dealers and manufacturers was positive during lockdown, with encouragingly strong enquiry levels.

Since June 1, dealers in England have been able to reopen and the positive theme continues, with strong demand for new and used machines during the first couple of weeks. Indeed, some dealers are reporting stronger sales activity than normal for the time of year. However, there is concern about stock supply from some manufacturers due to global lockdowns hindering production. There are issues with used stock too, due to fewer recent part exchanges, particularly in March. As a result, dealer stocks are running low and they are currently paying strong money to replenish.

What can the industry expect moving forward?

It is very early days and although activity in the market has burst into life since June 1, the next few months are going to be critical. With many people furloughed on a reduced income and redundancies inevitable as the economy suffers, spending confidence may be hindered. However, as increasing numbers of commuters return to work many of whom may not want to use public transport, the value for money alternative of a motorcycle or scooter could help to boost the market. This could already have started as scooter and moped registration categories suffered the least decline in May.

The used market is likely to fair better this year as economic issues lead to tighter budgets, steering more customers towards used purchases. However, a lack of used stock linked to some very tempting deals on new machines will support some recovery in the new market.

Sales Environment

In view of the market experiencing strong activity and signs of stock availability difficulties, residual values are likely to be buoyant.

Taking this into account and some careful consideration of the current situation, the majority of values have been held for July’s data, except where trade feedback and evidence from the market place suggests further adjustment where necessary.