Article Type: News

Jeep Wrangler: a sensible choice?

Jeep Wrangler: a sensible choice?
Although not a direct descendant of the famous World War II Willys Jeep, so synonymous with classic war films, the Jeep Wrangler’s design was (and still is) heavily influenced by it. Despite an increasingly crowded SUV market, its rugged, no compromise looks continue to make it stand out and thrive.

Running until 1986, the Jeep CJ models preceded the Wrangler. They were more utilitarian and stripped down, in a similar vein to the original military Jeep. Indeed, CJ stands for Civilian Jeep. By the 1970s and 1980s, the CJ-7 became popular as a recreational car, not just as an off-road work horse, so needed better road manners, stability and comfort.

Launched in Chicago, with production running from 1986 to 1995, the Jeep Wrangler (model YJ) bore a strong resemblance to the CJ-7, with a new design incorporating:

  • Square headlights
  • A wider stance
  • Reduced ground clearance
  • Increased comfort
  • Improved safety and handling

In 1996, release of the second generation (TJ) reverted to round headlamps and used coil springs to improve on road comfort. Other major changes included the addition of a long wheelbase and two extra doors from 2004. Production of the TJ ceased in 2006.

The third generation (JK) Wrangler entered production in 2006 and ran until 2018. Developed under Daimler Chrysler this was a “bottom up” new design, including features that were “standard” on road cars. The four door long wheelbase models outsold the two-door version.

The latest completely new generation (JL) launched in 2018 with a clear objective to retain the iconic Jeep look while remaining true to itself. The JL retains legendary off-road capabilities and introduces advanced technology for the first time. The result is the most capable Wrangler ever, courtesy of unmatched technical features, mated to efficient engines and smooth gearboxes.

In the UK, sales remain small but steady at approximately 500 units a year for the last 10 years. They have become somewhat of a cult car, and with its retro styling, a hit with the more fashion conscious looking for some originality. This combination along with the relatively small numbers available to buy in the second hand market keep residual values high compared to similar market categories.

Jeep RV percentage of cost new comparison graph

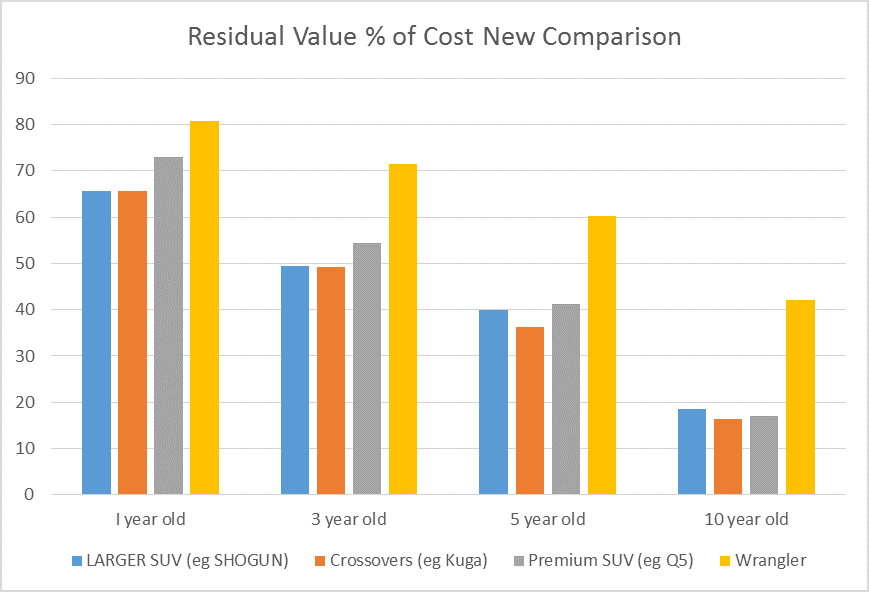
The chart above shows the Jeep Wrangler’s residual value performance throughout the different ages, from one to 10 year olds. It is clear to see that the Wrangler’s rate of depreciation is favourable compared to similar rivals.

Will the UK automotive sector weather the perfect storm of WLTP and Brexit?

In line with Autovista Group’s downside forecast for the year, new car registrations fell by 6.8% in the UK in 2018. The seasonally-adjusted annualised rate (SAAR) of new car registrations weakened again in December suggesting that there are still WLTP-induced supply constraints and also that the uncertainty surrounding Brexit is hurting consumer confidence and in turn new car demand. With the pressure on new car demand and residual values because of the relentless uncertainty surrounding Brexit, how will the UK automotive sector weather this perfect storm?

The only certainty in the UK as far as Brexit is concerned is uncertainty and this has been amplified even further by the UK Parliament’s rejection of the Government’s Brexit deal on Tuesday evening (15 January), albeit followed by a vote of confidence in the UK Government on Wednesday evening (16 January). Nevertheless, Autovista Group has developed a view on the outlook for new car demand and residual values in the UK.

New car registrations were already down by 6.3% year-on-year in the first half of 2018 but were buoyed by buying activity in July and August prior to the implementation of WLTP. Consequently, new car demand recovered to a decline of only 4.2% in the first eight months of 2018. However, the volume of registrations in September was at its lowest level since 2011 and with little over 450,000 new cars registered in the final quarter, this was the worst Q4 since 2012.

New car registrations SAAR graph January 2012 - December 2018
Source: Autovista Group based on SMMT data

Autovista Group’s new car market forecast for 2019

It is not possible to quantify the exact volume of new car registrations that were lost in 2018 because of WLTP and, similarly, the volume that was lost due to an underlying downturn in demand. We estimate that up to 100,000 new car registrations were lost between September and December 2018 because of the combination of these issues. In December alone for example, more than 18,000 fewer cars were registered than in the Autovista base case forecast. Given this, some volume was added in to our forecast for 2019 but this did not compensate for the reduction to the base case, downside and upside forecasts because of the indication that demand is broadly weakening on the back of rising inflation and weakening consumer confidence.

Rising inflation and weakening consumer confidence graph 2019
Source: OECD

The base case forecast calls for a further contraction of the new car market in 2019, albeit of just 0.6%. However, even this broadly assumes that the UK’s departure from the European Union will maintain free trade in a transitional phase and that interest rates and inflation will not rise and that pound sterling will not devalue further. In an upside scenario, which assumes ongoing free trade through a customs union and stable inflation and interest rates but a strengthening of the UK currency and healthier economic growth too, the new car market could even expand by up to 4%. On the downside, assuming the UK leaves the EU with ‘no deal’ and that WTO trading rules come into effect, consumer confidence and the economy weaken and interest rates and inflation rise, new car registrations could fall by up to 10%.

UK new car sales outlook graph 2012-2020
Source: Autovista Group/SMMT

These volume forecasts may sound high given the current state of Brexit flux but it is worth reiterating that a high volume of registrations were deferred from 2018 to 2019 because of the supply issues following the implementation of WLTP.

Used car market and residual value outlook

Based on the latest used car market data available, Autovista Group estimates that the volume of used car transactions fell by 2% in 2018. Demand for used cars was therefore far more resilient than for new cars. Looking ahead, the performance of the used car market and residual values will be dictated by the new car market as consumers may opt for a used car more than a new car given the current climate. In fact, the worse the news for the new car market, the better the expectation for the used car market and in turn residual values. As it currently stands, our residual value outlook calls for stability in residual values in the 12 month/20,000km scenario in 2019. In the 36 month/60,000km scenario, we forecast that values will fall by 1% in 2019 but these assumptions will naturally change if the trend of consumers opting more for used cars than new materialises.

The upshot is that the only certainty for the UK automotive sector continues to be uncertainty but the used car market and residual values will definitely weather the raging perfect storm better than the new car market.