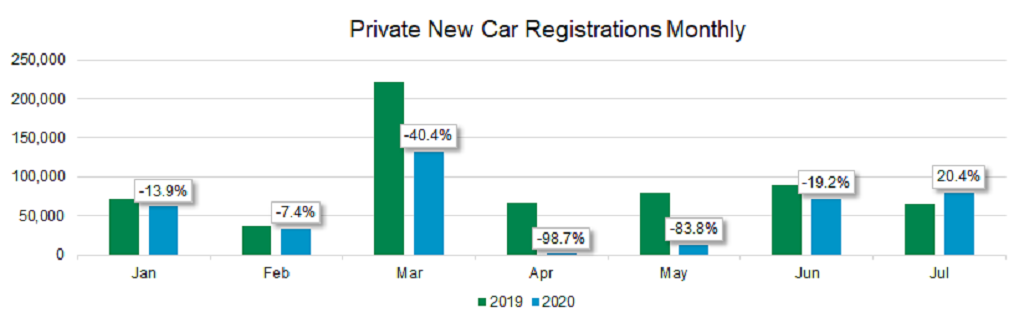
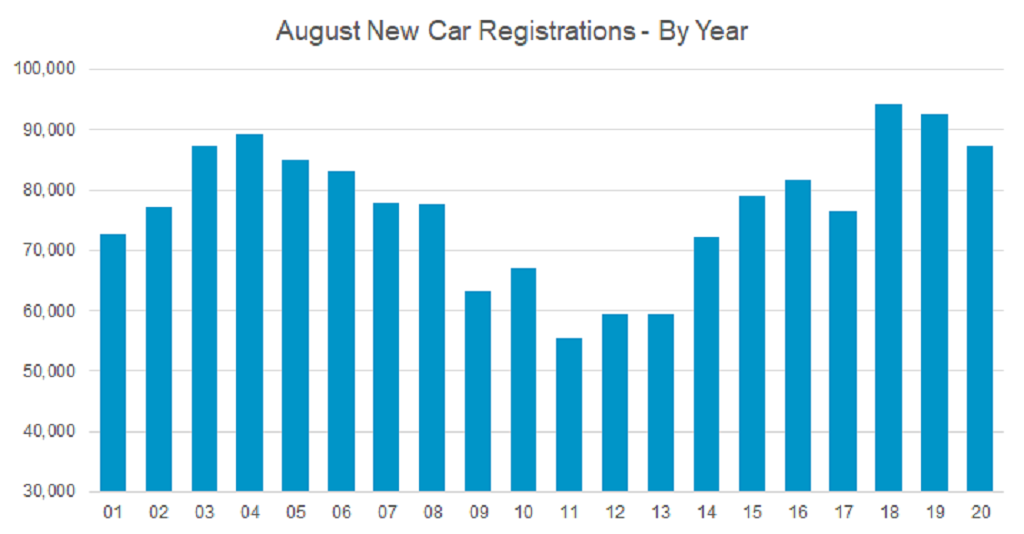
Article Type: Insight

New Car Market Update September 2020

The latest figures released by the Society of Motor Manufacturers and Traders (SMMT) showed that registrations in August declined by 5.8%, suggesting another very disappointing month for the industry. However, delving a little deeper into the data suggests that August 2020 is not quite as bad as first impressions show.

The decrease was only 5,347 units compared to 2019, as August is traditionally the lowest volume month of the year. This equates to less than half a per cent of 2019’s total annual sales. Additionally, August’s total of 87,226 units is, in fact, the fifth-highest August since the start of the revised registration frequency back in 2001.

New car market august registrations by year graph 2020

Data courtesy of SMMT

The August sales reductions in the major European markets of France, Germany and Spain were considerably worse, down 19.8%, 20% and 10.1% respectively, despite government-backed incentives in place to stimulate demand, which customers in the UK currently do not enjoy.

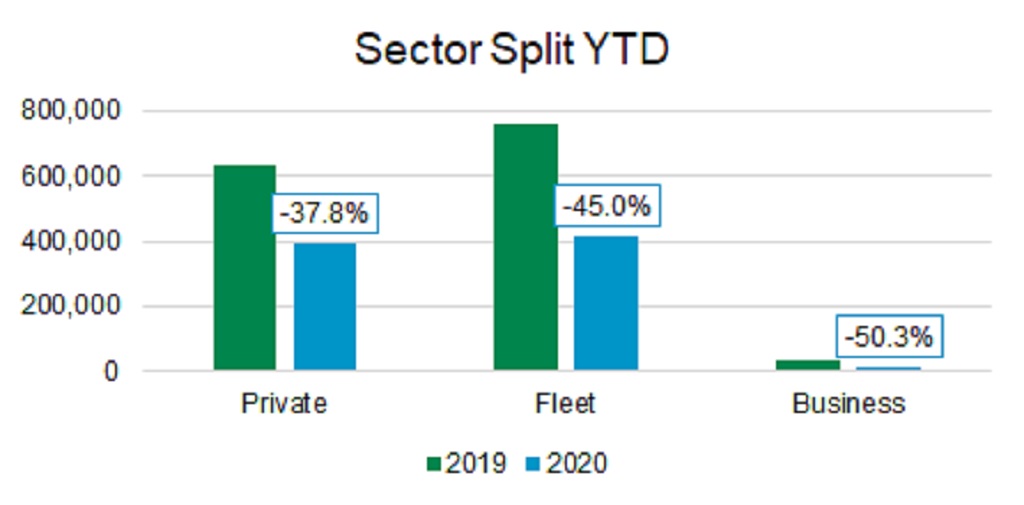
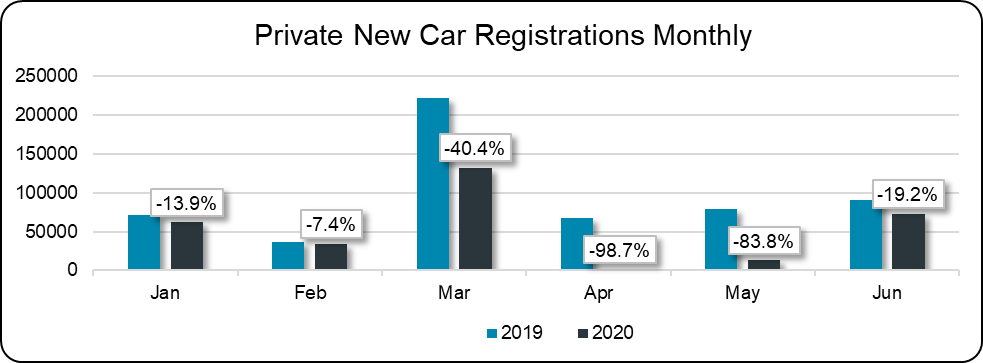
Through the sales channels, once again private retail sales performed better than fleet/business with only a 1.7% decline (699 units) on last year, which shows some stability in consumer confidence which is vital for the economy as a whole moving forward. Fleet activity was down 5.5% and Business sales channel dropped 57.9% albeit on a very small total.

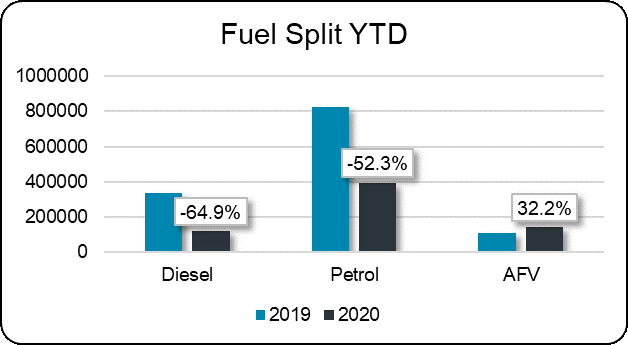
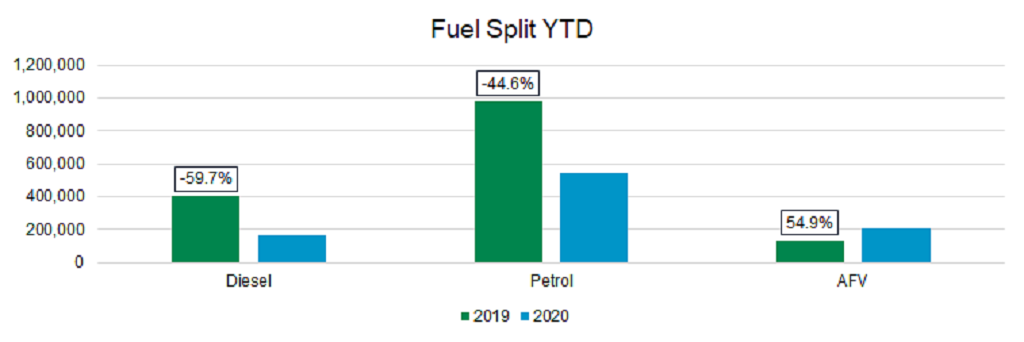
Analysing the fuel types shows a similar story, with zero and low emission registrations increasing and gaining market share from petrol and especially diesel. Battery electric cars increased by over 77%, achieving 6.4% of the total sales in August and now stand at almost 5% market share year to date, while pure diesel has declined almost 60% this year.

New car market Fuel split YTD graph September 2020

Data courtesy of SMMT

The top ten best sellers list for the month is back to normality with the Fiesta, Focus, Golf and Corsa all in the top five. However, there is additional good news for Ford as the new Ford Puma small crossover came in fourth place.

Fleet was once again a laggard this month compared to private sales. For the industry to get fully back on track it needs businesses to feel confident with a sustained period of economic improvement after the tumultuous first half of the year. At this point, more businesses will feel confident enough to invest in new car lease contracts.

There are some headwinds including uncertainty over Brexit negotiations on the withdrawal and any new trade deal with the EU. Additionally, the impact from Coronavirus flare-ups this autumn and winter may well force yet more delay on large expenditure commitments by businesses. As noted before, September is a critical month for the car industry and will set the tone for the rest of the year.

Used Car Market Update September 2020

Auction Wholesale Market

As expected, the rate of recovery of the used car market in the UK slowed a little in August. The key metrics of First Time Conversion Rate, Percentage of Original Cost New, and Sales observations Index ended the month lower than for July, although all still performed better than in August 2019. This suggests that “normality”, or what passes for that in these strange times, is returning to the market.

First time conversion rate graph September 2020
Used car market % original cost new graph Septmeber 2020

Taken at face value, the month-on-month reductions may be thought of as a bad thing. However, as with most statistics, it is important to consider a longer-term view. Although auctions remain only online, sale volumes are higher than at the same time last year and the decline from July is minor. There is a degree of “catch up”, but as the whole market was frozen during the lockdown, there is not a particularly large build-up of unsold stock with vendors.

Cars may not have been selling during the lockdown, but at the same time, they were also not being de-fleeted or part-exchanged. The high first-time conversion rate suggests that demand is keeping up with supply. This is supported by the average percentage of original cost new showing that buyers are keen to buy and are prepared to pay good money.

Wholesaler buyer demand

Sales of SUVs and convertibles have been noticeably strong since auctions resumed, the latter helped by the excellent summer weather. One area of the market where the Glass’s Editorial team continues to monitor very closely are alternative fuelled cars, especially battery electric vehicles (BEVs) as demand for these continues to fluctuate every month.

Used Retail Market

The Used Retail Market continues to perform well. The number of observed sales has improved slightly over July but is still lagging behind the same period last year. However, like the wholesale market, the average sale price is notably higher than at the same point last year.

Used car market retail observations graph September 2020
Used car market average sale price graph September 2020

Glass’s Live Retail pricing tool also shows that the average time a car spends on the forecourt continues to decrease and is at virtually the same level as last year – 45.5 days for August 2020 compared with 42.1 days for August 2019. This measure is a good indicator of the level of used car retail demand and the rate of improvement suggests that September’s value should show further improvement.

Used car market average days to sell graph September 2020

September 2020

Despite the challenges resulting from an online-only wholesale market and socially-distanced retailing, it appears that both the wholesale and retail used car markets have largely recovered, or even improved on pre-lockdown levels. Whilst is it tempting to be enthusiastic and positive about their prospects we are still operating in very uncertain times. A second full national lockdown is highly unlikely, although not impossible. However, localised and regional lockdowns are already in use and will continue through to the end of the year, and probably into 2021.

However, there is no harm in a bit of cautious optimism. September brings the new 70-plate and September’s new car registrations may exceed those of March; another example of the way 2020 has been turned upside down by COVID 19. New car registrations generate used car activity. This means that through September, especially the latter part, there are likely to be improvements in the key metrics for both the wholesale and retail markets.

LCV Marketplace Update September 2020

New Light Commercial Vehicle (LCV) Market

The light commercial vehicle (LCV) sector continues to navigate a period of instability, remaining sensitive to economic changes. The typically quiet month of August returned a disappointing 16.1% decline in demand for new LCVs. Overall, only 19,407 new LCVs hit UK roads during the month, as all sectors returned declines in registrations.

Performance year-to-date has declined 38.6%, with 136,577 units registered during the first seven months of 2020. Although July was an improvement on the same month last year, the initial pent up demand is likely only to mask a fragile market. Breaking the month down by sectors reveals that registrations increased 24.9% for Pickups, 12.0% for Vans between 2.0-2.5 tonnes and 5.4% for Vans between 2.5-3.5 tonnes, whilst Vans under 2.0 tonnes declined 22.0%.

Top five LCV registrations

The latest July SMMT new LCV registrations reforecast for 2020 is down 26.3% to 269,000 units for the year. Lockdown has placed all businesses under great financial pressure, with underlying weakness in the market.

Although there is a gradual improvement in demand, the UK is still a long way off normal. The pandemic has affected many businesses and a second wave of localised lockdowns has not helped.

The interconnected nature of the UK economy means that there is likely to be more uncertainty ahead as the UK grapples with a reduced appetite and business nervousness and the possibility of further regional lockdowns. Moving forward, fleet renewals will be critical to a successful restart and the UKs long-term green recovery given the crucial role light commercial vehicles play.

July Used Light Commercial Vehicle (LCV) Overview

With auction houses now at near full operational capacity, the used LCV market continues to deliver outstanding performance. Supply shortages and increased demand are keeping prices high at present however, there is a growing caution against the risk of weakening retail demand linked to a possible second spike in COVID-19 and further lockdowns.

Glass’s auction data suggests the number of sales in July were up 14.0% versus July 2019, with first-time conversions increasing for the fourth month in a row.

There is a growing appetite from trade buyers to purchase good quality stock. Sales of Euro 6 light commercial vehicles increased to just under 50% of the overall total in July, with the number of different online buyers increasing as well. Supporting this enthusiasm is data confirming average prices across all ages and sectors have risen 39.0% versus July last year.

July in detail

The average age of sold stock in July rose from 64.8 months in June to 69.5 months. This figure was 3.4 months lower than the same point last year.

Average first-time conversion rates stand at an extraordinary 92.3%, up from 86.5% in June and up from 76.7% 12 months ago.

Average mileage for sold vehicles stands at 71,878 miles, an increase of 2,226 miles on June but nearly 8,500 miles less than July 2019.

Glass’s continues to monitor the LCV market closely and has an open dialogue with auction houses and manufacturers, leasing and rental companies, independent traders and dealers as well as the main industry bodies. This information, combined with the wealth of knowledge in our CV team ensures Glass’s valuations remain relevant in the market place.

Motorcycle Market Round Up September 2020

Market Overview

Since motorcycle dealers reopened following lockdown, the market has remained busy with strong sales and enquiries throughout August. However, dealers are starting to experience quieter periods, typical in a ‘normal’ year, with August and September holidays. The Glass’s team will follow the market with interest over the final quarter of the year, as summer turns to autumn and the furlough scheme closes with the inevitability of redundancies.

As increasing numbers of employees return to work they continue to seek alternatives to public transport raising expectations that for the remainder of the year, the commuter market will remain buoyant. CBT training centres remain busy, good news for the industry’s future, with the potential of at least some new riders progressing to full licences. With the average rider age now approximately 55, this fresh interest is welcome news.   

Top Selling Models

Scooters and 125cc remain in high demand, driven by the increase in interest from commuters, however, a broad range of machines including higher priced examples continue to enjoy strong demand.

Stock

Supply continues to improve due to increased new sales generating more part exchanges. Larger dealers report having a good selection of stock and are satisfied with their stock levels, although it remains challenging sourcing quality scooters and 125cc machines. To supplement part exchanges, most dealers continue to proactively maintain stock levels to match demand.

Sales Activity

Today, the market continues to be buoyant, with autumn approaching and the furlough scheme drawing to a close, the next few months are looking increasingly uncertain. The weather in the first half of September provided excellent riding conditions, growing the chances of an extended sales season. Taking this into account and after some careful consideration, many values have been eased back for the October guide, except where trade feedback and evidence from the market place suggests further adjustments where necessary.  Exceptions to this are mopeds, scooters and commuter machines where values have been held, due to strong demand.

The Van’s Headlights: Peugeot Bipper

The Van’s Headlights

With conversion rates and average selling prices reaching new heights, the used light commercial vehicle (LCV) market is currently in fine fettle. A shortage of stock and a reduction in rental de-fleet volumes are driving these records. Interestingly, nearly 50% of all auctions sales are now for Euro 6 stock. In this month’s edition of The Van’s Headlights, we consider the merits of Peugeot Bipper Professional 1.3HDi 80bhp Euro 6 van (2016 – 2017).

The Glass’s Commercial Vehicle Editorial Team continue to scour the market in search of models offering the highest levels of versatility and durability whilst adding their experience to spot the best value for money available.

The Peugeot Bipper

Revealed in October 2007 and launched the following June, the Bipper is the smallest van in Peugeot’s LCV line up, underneath the Partner, Expert and Boxer. It was specifically designed as a high cube van with a generous load volume and a payload comparable to the larger Partner van.

Built as part of a joint venture with the Citroen Nemo and the Fiat Fiorino at Fiat’s factory in Bursa, Turkey, the Bipper is designed for urban deliveries. Featuring a wrap-around bumper protecting setback headlights, bonnet and radiator. Additionally, the wheels were pushed into each corner, delivering compact dimensions and maximising interior space.

Peugeot Bipper van side view

Available with a choice of either a 1.4-litre 75bhp petrol engine or a 1.4HDi 70bhp diesel engine emitting only 119g/km of CO2. The HDi diesel engine was also available with an optional electronically controlled manual gearbox, a first for a Peugeot light commercial vehicle.

The Bipper launched with S and S+ trim levels and along with the Nemo and Fiorino was voted joint ‘International Van of the Year’ 2009. An optional five-speed electronically controlled 2 Tronic manual gearbox was introduced in August. Based on the standard manual gearbox, the 2 Tronic delivered improved CO2 of 116g/km and 64.2mpg. The top of the range Professional variant was added to the range during the summer of 2009.

Standard equipment on the S+ included one-touch electric front windows, electric adjustable and heated door mirrors, remote control central locking with separate cab and load area locking, deadlocks and automatic drive-away door locking. In addition to the S+ specification, the Professional specification included air-conditioning, Bluetooth, a half-height bulkhead & grille or full steel bulkhead and 14-inch wheel-trims.

The Bipper S+ changed its name late in 2009 to the SE with a slightly improved level of specification.

Options included a Comfort Pack featuring driver’s seat height adjustment, lumbar support and armrest, reach and rake adjustable steering and integrated clipboard. The Tough Pack added 15” wheels and 185/65 R15 tyres, door sill protectors and mouldings, washable cabin floor covering, raised suspension, front and rear mudflaps and an under-engine protection tray (not available on 2 Tronic).

Servicing is required every 20,000 miles or two years, regardless of engine type. To reduce costs and downtime further, the oil change and air filter, diesel filter, pollen filter and brake pad replacements were all scheduled to coincide with the service interval. The timing belt replacements are due every 140,000 miles or 10 years on the diesel engine, and 90,000 miles or 10 years on the petrol version.

In August 2010, PSA decided to extend the current 60,000-mile warranty to 100,000 miles.

In April 2016, the Fiat Fiorino received a facelift incorporating a new front bumper, a new steering wheel and infotainment system in the cabin. New Euro 6 compliant engines were also introduced at this time. Although both PSA vehicles received the new Euro 6 engine, the Bipper and Nemo did not receive a facelift and were dropped from their light commercial vehicle line-up late in 2017.

A practical choice

Andy Picton, Glass’s Chief Commercial Vehicle Editor recommends the Peugeot Bipper as “a practical and economical van ideally suited to light urban deliveries”

Andy added, “Although no longer available new, the Bipper is a popular van in the used market. Its diminutive footprint belies a van that can accommodate a standard Euro pallet, offer a payload on a par with bigger vans and still returns over 60mpg. Ideal for urban courier work, the Bipper is supported by a strong Peugeot dealer network”.

Peugeot Bipper Professional 1.3HDi 80bhp Euro 6 van (2016 – 2017)

The Peugeot Bipper range

  • One body style
  • 5-speed manual gearbox
  • Three trim levels
  • Euro 6 engine line up
  • 660kg payload
  • Combined 64.2MPG/CO2 emissions – 115g/km
  • Variety of options
  • Available in a choice of six exterior colours – three solid and three metallic

Five models made up the Bipper van range – S, S ATV (All-Terrain Vehicle), SE, Professional and Professional ATV. All models were powered by the same 1.3HDi 80bhp Euro 6 engine, with standard specification including ABS and ESP, Driver’s ladder frame protector, radio/CD player, 12v plug, 6 tie-down load area hooks, 15” steel wheels and twin rear asymmetrical doors.

Additionally, the recommended 2016 Bipper Professional added as standard; air conditioning, side loading door, half-height bulkhead with mesh grille, TomTom GO 5000 Semi-integrated Navigation system, ‘Blue & Me’ handsfree Bluetooth phone kit, driver’s seat height adjustment and lumbar support, driver’s seat armrest, electrically adjustable heated door mirrors, reach and rake adjustable steering wheel and integrated A5 sized clipboard.

Bipper DimensionsBipper Load SpaceBipper Miscellaneous
Length3,864mmLength1,523mmGross Vehicle Weight1,750kg
Width2,019mmMax Width1,473mmPayload660kg
Height1,782mmWidth between arches1,046mmWarranty3yrs/100,000m
Wheelbase2,513mmHeight1,178mmService Intervals20,000m
  Volume2.5m3 

2016 Pros2016 Cons
Economical diesel enginesFront Suspension bearings can fail
Large cargo areaOlder engines prone to faulty connecting rod bearings
Agile city vanBattery can fail due to insufficient charge
Low running costsStandard safety kit is basic – ABS and driver’s airbag
 Diesel engine has to work hard on motorway trips
 Noticeable body roll on bends  
 

Glass’s recommendation

Peugeot Bipper Professional 1.3HDi 80bhp Euro 6 van

Registration Plate: 2016/16

Mileage: 53,000 miles

Glass’s Trade £2,950 Excl VAT

Glass’s Retail £4,075 Excl VAT

A Look At The Renault Megane

At the Frankfurt Motor Show in September 1995, Renault unveiled the Megane, the successor to the Renault 19.  The Megane was Renault’s first model to reflect their new focus on safety. It featured a pillar mounted three-point seatbelt for the rear middle seat replacing the lap strap, and a year later passenger airbags became standard. A far cry from the safety features we enjoy today, but a real step forward versus contemporary competitors.

Over four generations, the Megane has been on UK roads since 1996. It has proved a diverse model range having been available as a three and five-door hatchback, saloon, coupe, convertible, estate and MPV at various points in its lifecycle.

Unveiled as a replacement to the Renault 19, it was in effect essentially only a reskin, using modified chassis, engines and transmissions from the 19.

In the spring of 1999, Renault launched a mild facelift with a modified grille, improvements to safety features and upgraded equipment whilst introducing 16 valve petrol engines. An estate body style also joined the model range.

By September 2002 Renault launched Megane II. As adventurous as its predecessor was staid, the Megane II range created demand for Megane when many buyers would never have considered the ageing and frumpy original. Spawning a huge number of variants. Aside from the original three and five-door hatches, there was a compact estate, a saloon and the sleek Coupe Cabriolet as well as the Scenic and Grand Scenic variants.

This second-generation voted as ‘European Car of the Year’ in 2003, became the first vehicle in its class to receive a five-star EuroNCAP rating. The body styling was based on Renault’s new design language premiered on the Avant Time and immortalised in the 2003 ‘shaking that ass’ advertising campaign. Compared to the first generation, this version benefitted from a raft of innovative technologies, including a keyless ignition system. January 2006 saw the second generation facelift, with changes to the interior, enhanced specifications levels and a remodelled nose.

In October 2008 the Megane III launched in 5 door hatchback and coupe body styles to subdued UK reviews. Although the two models benefitted from differing designs with the coupe having a sportier stance and the hatchback reflecting a more conservative design, the overall bland styling limited the appeal of Megane III in the UK.

Mid-2009 saw the estate version, the sports tourer launch, the following summer the coupe cabriolet version was added to the range. 2012 saw its first facelift which included three new engines, one petrol and two diesels. In 2014 the final facelift for the third generation vehicle included more powerful engines while the hatchback, coupe and estate variants got styling upgrades to match Renault’s new styling.

At the Frankfurt motor show in September 2015, Renault unveiled the fourth-generation Megane which went on sale the following July. Based on the same platform as the larger Espace and Talisman – big Renaults we don’t get in the UK – it benefits from their technology and much of their style. A significant leap forward from Megane III. It is larger and lower than the predecessor and only available as five-door hatchbacks and estate versions.

Over the years, the Megane has proved to be a popular and practical choice, offering a mix of style and space, together with value for money, particularly in the used car market. The following chart shows the average Glass’s residual value for a three-year-old Megane compared to the average for the C segment, containing models such as the Volkswagen Golf, Ford Focus and Vauxhall Astra. It is clear, in this segment, that petrol models consistently hold more residual value and that in general, Megane values track marginally below the segment average, adding to their appeal in the used car market.

Average RV% Renault Megane vc C-Segment graph

Away from the volume derivatives in the C-Segment, since 2004 Renault has marketed the Renault Megane RS (Renault Sport), a series of high-performance hatchback models based on the Renault Megane. The Megane RS has won many awards such as “Best hot hatch” from What Car? (2010–2014), “Highest placed non-supercar” in Evo’s annual Car of the Year test 2011 and “Best hot hatch” from Top Gear.

Creating a halo for the Megane brand, in the same manner as the Golf GTi for Volkswagen, the Megane RS delivers excitement where the standard range has traditionally missed. Now in the third incarnation, based on Megane IV the newest Megane RS is only available in 5-door hatchback body style and was developed with the assistance of Renault F1 Team driver Nico Hulkenberg.

Secret Diary Of a Forecast Editor June 2020

When Tesla launched the Model 3 in the UK it was even more of a game-changer than the hugely successful Model S. A mid-sized saloon delivering excellent range with zero emissions. With a starting price close to £40,000 it makes an excellent proposition, especially for fleet users. Pitching the Model 3 into the heart of fleet driver territory whilst giving company car drivers usually choosing premium upper medium diesel saloons, a viable electric option. The main rivals capable of offering affordable long-range battery electric vehicles (BEVs) of a practical size previously were the Nissan Leaf, Hyundai Kona Electric and the Kia e-Niro.

Ionity EV charging point

The resulting popularity of the Model 3 is such that Tesla have not been able to supply enough vehicles to satisfy UK demand. This demand shows little sign of falling. Due to the lockdown and the stalled delivery of the majority of new cars, the Tesla Model 3 had the highest registration tally of all new cars in May 2020 according Society of Motor Manufacturers and Traders (SMMT) data with 852 registrations. Clearly, this figure is much lower than the biggest seller would ordinarily achieve in a month, but it highlights that due to Tesla’s online ordering process, the demand and supply of their cars has continued.

Blue Mustang front side view

The Pony interloper

Tesla’s grip on the company car market could be put under pressure in the coming months as Ford prepares to launch what might prove to be a worthy adversary of the Model 3.

The new Ford Mustang Mach E appears to be a credible alternative for those that may have previously only considered the Model 3. Of course, there will be those who will still only consider the Tesla due to the favorable image that the brand has managed to conjure in the relatively short life of the company, but the Mustang Mach E is arguably a better-looking car whilst also offering the popular SUV silhouette.

This is Ford’s first ground-up BEV project. Created as a family sized SUV, fulfilling the requirements of high proportions of buyers today, the Mustang name instantly gives the vehicle an exciting and emotional integrity.

Ford have continued communicating with the Glass’s editorial team regarding the Mustang Mach E during lockdown. They started taking pre-orders online and it is proving very popular with the First Edition already selling out.

Andy Cutler, Glass’s Forecast Editor commented, “I for one really cannot wait to get behind the wheel of the Mustang Mach E; I was supposed to drive it just as lockdown started and this has meant that we will have to wait a while longer to get behind the wheel which is really frustrating”.

Mach E Details

The Mustang Mach E is a fully electric SUV available with rear wheel drive (RWD) or all-wheel drive (AWD), with a regular range or extended range drivetrain. The WLTP maximum range for the RWD standard mileage model is 280 miles and the car will be available for just over £40,000. The extended RWD model is priced just under £50,000 and is capable of a maximum WLTP range of 370 miles. AWD versions are also available, however the range does drop slightly.

Mustang Mach E side rear view
Mustang Mach E front side view

The car comes without door handles; instead, it senses the presence of the key and as you approach and a sensor on the B pillar lights up and you touch it to enter the car, it automatically locks itself when you leave the vehicle.

Mustang B pillar touch light up

The Mach E uses Ford’s latest generation of their SYNC system: this system allows the driver to customise and update the Mach-E’s drive right from a mobile device or desktop. It also includes a cloud-connected navigation system, along with modem-based over-the-air updates which Ford claim will be almost invisible to the user. Interacting with the Ford SYNC system will be via voice commands or the 15.5” touchscreen display.

The standard specification is extensive although if you want slightly more kit then go for the extended range model benefiting from panoramic roof, 360 Degree Camera and B&O Premium Sound System amongst other additional specification.

The Mustang Mach-E is equipped for both AC charging, with its 10.5 kW on-board charger, and DC charging. This allows the standard range model to take a 115kW charge and the extended range model will take 150kW allowing top ups of 73 miles in about 10 minutes. With a home charging unit you get around 27 miles per hour so overnighting charging should be enough to attain full range.

The rise of the BEV

Over the past couple of years, ranges have increased greatly and purchase prices have reduced, with the latest models making compelling cases for being your next vehicle. Throw in the fact that incentives for company car drivers are currently so rewarding it is understandable why demand for the latest BEVs is so high.

The issue for many BEVs capable of achieving longer ranges has been the initial purchase price. Putting them out of reach of the majority of drivers, models such as the Tesla Models S & X, Jaguar i-Pace, Audi e-Tron and Mercedes-Benz EQC all costing over £60,000. The Tesla Model 3, Kia e-Niro, Hyundai Kona Electric and now the Mustang Mach E offer real-world range twinned with prices making them more affordable for businesses to run as company cars for higher mileage users. This is the dawn of a new automotive era. Soon there will be many more rivals offering excellent range at more affordable prices, for now though, the Mustang Mach E is a car to look forward to driving whilst the competition between manufacturers hots up.

Motorcycle Market Round Up July 2020

Following a strong recovery in June, motorcycle registrations accelerated in July.  Motorcycle Industry Association data shows registrations grew 42% versus July 2019 with all nine categories experiencing increases. However, like last month, it was the scooter category that recorded the strongest growth.

Glass’s Leisure Vehicles Editor Paul McDonald said, “After an impressive rebound in June, registrations gathered pace in July. However, whilst this is great news for the industry, I would suggest caution moving forward as Covid-19 makes its presence felt on the economy and especially the job market”.

Engine band highest registering model July 2020

 Power BandModelRegistrations
0-50ccLexmoto ECHO 5090
51-125ccHonda PCX 125458
126-650ccRoyal Enfield Interceptor INT 650193
651-1000ccTriumph Tiger 900 GT PRO109
Over 1000ccBMW R 1250 GS Adventure207

Data courtesy of the Motorcycle Industry Association

Dealer Feedback

Sales and demand remained strong through July with reports of records being broken at some dealers. A wide variety of machines are enjoying healthy sales, although scooters and 125’s continue to be registration driving force for dealers close to larger towns and cities. However, there was some evidence of sales activity slowing towards the end of the month as school holidays commenced.

Although demand remains strong, dealers are cautious about the longer-term economic effects of Covid-19 believing the market could feel the effects in September and October when the furlough scheme ends with the inevitability of redundancies and waning consumer confidence.

New stock is an issue for some dealers as demand outstrips supply. Lead times are unknown for certain models with a backlog of orders, whilst some dealers are looking towards early 2021 for deliveries. Used stock availability also continues to be an issue and some dealers believe sales would have been stronger if they had stock to fulfil demand. This situation is improving as elevated new registrations increase part-exchange supply.

What can the industry expect moving forward?

Following a period of ‘pent up’ demand, registrations in August will probably not experience the same level of growth compared to July. However, taking into account the late starting season, activity could still be stronger than a typical August. Moving further ahead, there is a reasonable chance the commuter market will remain buoyant as people return to work, seeking a two-wheeler as a cheaper and safer alternative to public transport. However, now the UK is officially in a recession, there is a chance demand for larger ticket items could suffer as increasing anxiety about job loss hinders consumer spending.

Sales Environment

There remains a degree of market uncertainty, with furlough schemes coming to an end and redundancies inevitable.  However, given the market currently remains buoyant and the possibility of an extended season due to the delayed start, residual values will remain steady. Taking this into account and some careful consideration, the majority of values have been held for the September guide, except where trade feedback and evidence from the market suggests further adjustments.

The Automatic Choice

The rise of automatic gearbox.

Ever since the first horseless carriages, engineers have tempted customers into vehicles where there were fewer pedals. The trend started in the USA and spread across the Atlantic with Europeans finding new and smoother ways of delivering automatic transmissions. These transmissions were once the preserve of premium and luxury motor cars, but have since been associated with vehicles in all segments including vans, buses and of course cars.

UK market penetration

From a market penetration perspective, in the UK by the year 2000, the new car registration ratio of manual transmission cars compared to automatics was around 86% manual to 14% automatic. From 2000 to 2010, a small shift occurred with manuals decreasing to 82% whilst automatics increased to 18%.

Driving the demand increases was the mating of automatic gearboxes with low revving, high torque diesel engines with excellent fuel economy. This was the ideal combination for an automatic gearbox. Unfortunately, few manufactures were able to capitalise on this increased demand, as automatic gearboxes struggled with reliability under such high torque loads.

Cog increases

By 2010, most manufacturers were producing reliable automatic gearboxes. The game-changing factor was the ability to increase the number of gears within the gearbox immediately improving fuel economy. The additional gears gave these new gearboxes increased flexibility for cruising at high speed in very high gears whilst still being able to crawl around town at low speed in low gears.

Like most technological advances user perceptions takes longer to change. Gradually the switch from manual transmission to automatic, in its many different versions, has accelerated. By the end of 2019, increased market penetration had driven registration of automatic cars to 36% up from 17% in 2009. In terms of registrations, this is a rise from just 335,314 in 2009 to 827,676 in 2019. Registration figures for the first half of 2020 show that the percentage of automatics sold is up another three percentage points compared to 2019, albeit the overall registrations for 2020 is artificially low due to Covid-19. However, the upward trend for automatics is very clear.

The release from the premium segments of paddle and button gear changers linked to automatic gearboxes gave a sporty image improvement to automatics moving them away from pipes and slippers to new younger audiences. This new desirable image has gone a long way to shift automatic gearbox perception long associated with poor economy and lacklustre performance.

New registrations by gearbox graph

Wholesale changes

In the auction market, data shows increasing volumes for both manual and automatic gearboxes from 2010 until 2019 when manual gearbox penetration starts to decline whilst automatic gearboxes continue to increase. Wholesale volume of automatic gearboxes in 2010 stood at 119,625 cars increasing to 368,772 cars in 2019.

Auction sale by automatic gearbox graph

The automatic choice

New car registration data shows demand for automatic gearboxes is continuing to rise with 39% of all cars registered so far this year (2020) being equipped as an automatic. It is likely, that within the next few years half of all vehicles registered will be automatics. This is partly driven by an ageing UK population and in parallel partly due to the benefits that have transformed automatic gearboxes. Combine this with ever slower and queuing traffic; the automatic gearbox has become an automatic choice.

Car Market Overview August 2020

New car sales

Manufacturers and dealers will take some comfort from the latest new car registration statistics from the Society of Motor Manufacturers and Traders (SMMT). Following a full month of trading across the UK, the new car market produced the first monthly positive result this year, being 11.3% up on July 2019, with pent-up demand finally materialising in registration numbers.

As July is not a high volume registration month, the increase has done little to impact the overall year-to-date position with the market sitting 41.9% lower than 2019 at just over 828,000 units. However, July’s result will give dealers and manufacturers some confidence that demand remains for new cars. With some attractive deals currently on offer, August should be similarly positive. However, the high-volume September plate change is the focus month for the industry, where delivering an increase versus September 2019 may prove difficult.  

Used market

With some auction providers reporting higher stock levels than last year and an increase of over 10 percentage points in the first-time conversion rate to 86.4%, it underlines the buoyancy of July’s auction market. Hammer prices were also strong, exceeding Glass’s Trade values by 3.3% on average, leading to an increase in Glass’s values in August. With auction activity and hammer prices showing signs of further growth through August, the expectation is further increases in values in September, bucking seasonal trends.

A strong retail market is driving this exceptional wholesale activity. In July the average days it took a dealer to sell a used car fell from 82 to 59 days according to Glass’s Live Retail pricing tool, rapidly returning to pre-lockdown levels (39 days in March) as fresh stock is added to forecourts.

Used Car Market Update August 2020

Auction Wholesale Market

The recovery of the UK used car auction market continued through July. The key metrics of first-time conversion rate, sale value and sale volume are returning to track with their pre-lockdown trends. However, the rate of improvement is slowing suggesting that an over-recovery, where the market overshoots and then goes through a period of decline, is becoming less likely.

Used car market first time conversion rate graph August 2020

Sale volumes have recovered to pre-lockdown levels, despite year-to-date new car registrations being down over 40% due to the lockdown. Reduced new car registrations are impacting the volume of part-exchanges generated and the number of contract hire and lease de-fleets.

With the major auction groups continuing to hold only online sales, some buyers continue to be wary about spending substantial amounts of money on vehicles they have seen in person. However, this trust continues to improve as buyers become more accepting of the descriptions provided by the auction houses.

With traditional physical auctions unlikely to return before the end of the year, all buyers are going to have to adjust to the new way of sourcing stock. Whilst there are some challenges around online auctions, there are also advantages – particularly the ability to visit several auctions all over the country in one day rather than spending several hours in the day travelling to one or two physical sites.

Used Retail Market

The used car retail market is showing similar recovery behaviour to the wholesale market. The key measures – Average Sale Price and Days-to-Sell are both positive. Just like the auction market, their rate of recovery is slowing, suggesting they are approaching their natural level.

Used car market average sales price graph August 2020

Glass’s Live Retail pricing tool reports on the average time a car spends on the forecourt, with lower days to sell indicating higher retail demand. The average for July of 59.1 days is still 30% higher than expected, but in the circumstances is a distinct improvement over June’s average of 81.9 days. If the decreases continue over the coming weeks the value for August will be similar to August 2019.

Used car market average days to sell graph August 2020

Next Month

The trends of the key metrics for both the wholesale and retail markets continue to be positive. The rates of improvement are slowing, reducing the spectre of a “boom and bust” recovery and show trading is likely to return to seasonal levels within a few months. September will see the launch of the 70 plate generating more used car volume and activity, although typically the effect of this will not be seen until the latter part of the month.

Overall, registrations in September could exceed those for March, showing how “back to front” this year’s car market has been compared to typical seasonal activity.  The new car market is still catching up, however, Glass’s data suggests that total registrations for 2020 will be around 30% lower than in 2019.

Podcast: Running the numbers on incentives, registrations and residual values

The Autovista Group Daily Brief Team discusses the biggest automotive news stories of the last fortnight. In this episode, Tom Geggus talks incentive schemes, Neil King reviews registration figures and returning special guest Christof Engelskirchen wraps up residual values.

https://soundcloud.com/autovistagroup/running-the-numbers-on-incentives-registrations-and-residual-values

You can also listen and subscribe to receive further episodes direct to your mobile device on AppleSpotify and Google Podcasts.

Carmakers’ financial performance highlights COVID-19 crisis – Part 2

Daily Brief editor Phil Curry looks at carmakers’ 2020 quarterly and first-half financial performance, exploring how the coronavirus (COVID-19) pandemic has affected the automotive industry. In this second part, Curry explores the impact of COVID-19 on the financial performance of BMW, Daimler and Toyota.

The BMW Group delivered 962,575 BMW, Mini and Rolls-Royce premium-brand vehicles to customers worldwide in the first six months of 2020, down 23% compared to the first half of 2019. Group revenues fell 10.3% to €43.2 billion. Earnings before interest and tax (EBIT) for the six-month period amounted to €709 million, down 74.6%. 

As BMW expected, the negative impact of the COVID-19 pandemic was felt more sharply in the period from April to June. The carmaker reported a loss of €666 million in Q2, its first quarterly loss since 2009.

‘Our swift responsiveness and consistent management strategy enabled us to limit the impact of the corona pandemic on the BMW Group during the first half of the year,’ said Oliver Zipse, BMW chairman. ‘We are now looking ahead to the second six-month period with cautious optimism and continue to target an EBIT margin between 0% and 3% for the automotive segment in 2020. We are monitoring the situation very closely and managing production capacities in line with market developments and regional fluctuations in customer demand.’

Daimler – a challenging quarter

Daimler has issued a number of profit warnings in recent years, as it has struggled with EV development budgets, falling sales and the implementation of the Worldwide Harmonised Light-vehicle Test Procedure (WLTP). The COVID-19 pandemic has therefore added another layer to an already complicated situation.

The German carmaker reported that revenue slipped ‘significantly’ by 29% to €30.2 billion in Q2 2020. It reported a loss before interest and tax of -€1.7 billion, with a net loss of €1.9 billion.

‘Due to the unprecedented COVID-19 pandemic, we had to endure a challenging quarter,’ said Ola Källenius, chairman of Daimler. ‘But our net industrial liquidity is a testament to effective cost control and cash management, which we must continue to enforce. We are now seeing the first signs of a sales recovery – especially at Mercedes-Benz passenger cars, where we are experiencing strong demand for our top end models and our electrified vehicles. Going forward, we are firmly determined to continue to improve the cost base of our company. At the same time, we are committed to our key strategic objectives: to lead in electrification and digitalisation.’

Daimler countered the drop in demand by quickly suspending production in March, April and May, as well as introducing short-time working. To safeguard the company’s financial strength, expenditure and investments were focused on the most critical future projects. The company currently expects to return to profit by the end of the year.

Toyota turns a profit

Unlike Nissan, and other Japanese carmakers, Toyota reported a profit, albeit significantly reduced, in its 2021 financial year Q1 results, covering the period from 1 April to 30 June. The carmaker’s operating profits plunged by 98% compared to the same period last year, coming in at ¥13.9 billion (€110 million).

Net income tumbled 74% to ¥158.8 billion, as total retail vehicle sales, including those from Daihatsu and Hino, fell by 32%.

Toyota attributed its profit to a number of key elements that played out in the three months. First, the effects of foreign exchange rates decreased operating income by ¥75 billion. Secondly, cost-reduction efforts increased operating income by ¥10 billion. Lastly, the effects of marketing activities decreased operating income by ¥810 billion yen, largely due to the fall in sales volume caused by the spread of COVID-19.

The carmaker has not revised its forecasts for the year, which were made in May 2020, as it operates an April to March financial year. Therefore, it was able to take the COVID-19 effect into account when planning its year ahead. The company expects operating income will fall 79% to ¥500 billion in 2020/2021 while net income will slide 64% to ¥730 billion.

‘While we expect an increase in consolidated vehicle sales, we have left those forecasts unchanged given, for example, the possibility that the business environment will change significantly depending on such factors as the future spread of COVID-19 and the state of its containment,’ the company said.

Cautious optimism

Throughout the recent spate of financial results, one thing is clear. No company is currently able to accurately forecast its full-year results. Some have tried, with caveats added in case things change drastically, while others have simply said they are not in a position to produce forecasts in what is a volatile market.

However, there is cautious optimism, and as countries around the world start to get a grip on how to handle the COVID-19 pandemic, it is hoped that the extreme measures taken in March and April will not be repeated. What could cause further issues for the automotive industry is the economic impact, which has pushed some countries into recession and is increasing unemployment. These two factors that do not bode well for the purchase of new vehicles.

Read part one of Curry’s financial results round-up here. 

Carmakers’ financial performance highlights crisis behind COVID-19

Daily Brief editor Phil Curry looks at carmakers’ 2020 quarterly and first-half financial performance, and how the coronavirus (COVID-19) pandemic has affected the automotive industry. In this first part of two, Curry considers VW Group, Nissan, Renault and Ford.

Europe’s economy is in a state of flux in the wake of COVID-19 lockdowns, with Italy leading the way in extreme measures put in place to prevent the spread of the virus.

Some carmakers have weathered the storm better than others, and many remain optimistic that the impact is merely a ‘blip’ in their financial results, with improvements already developing.

VW – one of the most challenging periods

In its H1 2020 results, Volkswagen Group (VW) reported an operating loss of €803 million (before special items). This expanded to an overall loss in the first half of 2020 to almost €1.5 billion when special items are included. Vehicle sales were down 30% compared to the first half of 2019, while production fell 32.5%. Group sales revenue decreased by 23.2% to €96.1 billion.

Frank Witter, member of the group board of management responsible for finance and IT, said: ‘The first half of 2020 was one of the most challenging in the history of our company due to the COVID-19 pandemic. The health of our employees, customers and business partners is still the top priority. With our 100-points plan to ensure maximum health protection, we have, for example, created the best possible prerequisites for a safe working environment. At the same time, we introduced comprehensive measures aimed at reducing costs and securing liquidity early on, which enabled us to limit the impact of the pandemic on our business to a certain degree.

‘Thanks to the great team effort, we have gradually been able to ramp up operations within the Group and up until now, have steadily managed to navigate through this unprecedented crisis. Due to the positive trend exhibited in our business over the past few weeks and the introduction of numerous attractive models, we look cautiously optimistic to the second half of the year.’

Nissan – major losses

For the April to June period, consolidated net revenue at Nissan was ¥1.1742 trillion. The operating loss was ¥153.9 billion, equivalent to an operating margin of -13.1%. The net loss was ¥285.6 billion.

In its first quarter, Nissan’s global automotive sales fell by almost half amid the pandemic. To limit the spread of COVID-19, the company suspended production at manufacturing sites around the world. Nissan’s plants have since resumed operations but face reduced utilisation of their capacity due to lower demand. The company’s performance continues to be impacted by the challenging business climate, it said in a release.

Nissan raised concerns about its financial performance in April, saying that its full-year consolidated earnings ‘may differ by more than 30% from the previous financial forecast’ that was made in February. It is expecting an operating loss of ¥470 billion (€3.7 billion) for the year to March 2021.

Renault – impacted by Nissan

French carmaker Renault Group announced a €7.4 billion net loss in the first half of 2020, with the carmaker highlighting the negative impact of alliance partner Nissan’s results.

The contribution of associated companies came to -€4.8 billion, compared with -€35 million in the first half of 2019. ‘This decline came mostly from Nissan’s contribution, down €4.796 billion including -€4.3 billion of impairments and restructuring costs,’ the carmaker said.

Global sales dropped by 34.9%. However, the company stated it had a ‘high-level order book’ at 30 June, and sales of its Zoe electric model were up by 50%, highlighting the appeal of the technology. It is also likely that the generous incentive scheme in France helped the carmaker to increase sales in the period from 1 June.

No reliable guidance

However, Renault is unsure of how it will perform in the rest of 2020. ‘Given the uncertainties around the health situation, both in Europe and in emerging markets, Groupe Renault estimates that it is not in a position to give a reliable guidance for the full year,’ it stated.

Luca de Meo, CEO of Renault, declared: ‘Although the situation is unprecedented, it is not final. Together with all of the Group’s management teams and employees, we are fully dedicated to correcting the situation through a strict discipline that will go beyond reducing our fixed costs. Preparing for the future also means building our development strategy, and we are actively working on this. I have every confidence in the Group’s ability to recover.’

Ford quarter supported by Argo AI

Ford benefited from an investment made in its autonomous subsidiary Argo AI by VW Group, as part of a collaboration deal on driverless and electric-vehicle technology. Without the investment, Ford reported a loss for the second quarter of -$1.9 billion. Including the investment, the firm reported a second-quarter profit of $1.1 billion, up by $1 billion on the similar period in 2019.

Its H1 results reflect the wider picture of the coronavirus impact with six-month losses. For the first half of 2020, the company reported a loss of $900 million – a negative impact of $2.2 billion compared with the same period in 2019. Global sales fell 37% compared to the first six months of 2019.

Ford directed much of its capabilities and resolve in the second quarter to understanding and helping to meet the coronavirus-related needs of customers, dealers, suppliers, healthcare professionals and first responders, and patients and communities. Initiatives like enhanced and new online services, and deferred financing payments on new vehicles in the US, benefitted customers and Ford as commerce stalled, then began to recover. However, with the US yet to emerge from its first wave of coronavirus infections, let alone face a second wave, Ford’s global business may yet be facing deeper challenges in the second half of 2020.

In a follow-up article to be published tomorrow (14 August), Daily Brief editor Phil Curry explores the impact of COVID-19 on the financial performance of BMW, Daimler and Toyota.

August – Latest whitepaper update: How will COVID-19 shape used car markets?

As coronavirus (COVID-19) lockdowns are left behind, thoughts turn to economic recovery. However, as the latest update to the Autovista Group whitepaper ‘How will COVID-19 shape used car markets’ explains, in the last month, the situation has taken a gloomier turn.

Since the production of the previous report, the view of the crisis and its economic impact has darkened. Forecasts have been declining since the pandemic struck Europe, but they seem to not have fully bottomed out, yet.

In our July update of this whitepaper, 10 out of 18 markets assigned the highest risk to scenario three, ‘medium risk: slow u-shaped recovery.’ In this August update, 12 out of 18 markets have moved into this scenario.

Residual value impact

The whitepaper also highlights the impact on residual values (RVs) depending on the most probable scenario and country-specific circumstances.

The majority of countries assign a higher probability to the medium risk scenario 3, which describes a drop in RVs that is more substantial and drags on longer than scenario 2 countries. Towards the end of 2022, used cars will – on average – still trade around 3% lower than in March 2020. But there are substantial country differences in this scenario cluster.

Looking at the data presented, it becomes apparent that Southern Europe may be impacted worst, and will also suffer the longest. The Nordic region has received the most extensive adjustments in this whitepaper update. In Sweden and Finland, there are no government incentives directly supporting the automotive industry.

Three-speed RVs

Autovista Group has developed a COVID-19 tracker, which follows recent RV developments in 12 European markets. The indexed tracker starts in February, with a value of 100. In the UK and France, the tracker shows that the index of RVs has risen since mid-May and peaked at 103.7 (a 3.7% rise) in the UK and 101.8 (a 1.8% rise) in France in the week to 2 August.

Autovista Group anticipates a slowdown in the RV development in France and our latest residual-value outlook calls for prices of used cars to be 0.3% lower in France at the end of 2020 than when the Covid-19 crisis erupted in Europe, in March. Nevertheless, this is the most resilient expectation for all the European markets, according to the whitepaper.

You can find more information about how different markets are recovering, and the economic scenarios they are facing, in the latest update of the Autovista Group whitepaper – ‘How will COVID-19 shape used car markets’ which can be viewed here.

LCV Marketplace Update August 2020

New Light Commercial Vehicle (LCV) Market

With the coronavirus lockdown easing and businesses back to work, it is encouraging to record a 7.1% growth in the new light commercial vehicle market. This follows four months of double-digit decline. Overall, 27,701 new LCVs were registered during the month, with growth in all but the Vans under 2.0-tonnes sector.

LCV new registrations graph August 2020

Performance year-to-date has declined 38.6%, with 136,577 units registered during the first seven months of 2020. Although July was an improvement on the same month last year, the initial pent up demand is likely only to mask a fragile market. Breaking the month down by sectors reveals that registrations increased 24.9% for Pickups, 12.0% for Vans between 2.0-2.5 tonnes and 5.4% for Vans between 2.5-3.5 tonnes, whilst Vans under 2.0 tonnes declined 22.0%.

Top five LCV registrations

The latest July SMMT new LCV registrations reforecast for 2020 is down 26.3% to 269,000 units for the year. Lockdown has placed all businesses under great financial pressure, with underlying weakness in the market.

Although there is a gradual improvement in demand, the UK is still a long way off normal. The pandemic has affected many businesses and a second wave of localised lockdowns has not helped.

The interconnected nature of the UK economy means that there is likely to be more uncertainty ahead as the UK grapples with a reduced appetite and business nervousness and the possibility of further regional lockdowns. Moving forward, fleet renewals will be critical to a successful restart and the UKs long-term green recovery given the crucial role light commercial vehicles play.

July Used Light Commercial Vehicle (LCV) Overview

With auction houses now at near full operational capacity, the used LCV market continues to deliver outstanding performance. Supply shortages and increased demand are keeping prices high at present however, there is a growing caution against the risk of weakening retail demand linked to a possible second spike in COVID-19 and further lockdowns.

Glass’s auction data suggests the number of sales in July were up 14.0% versus July 2019, with first-time conversions increasing for the fourth month in a row.

There is a growing appetite from trade buyers to purchase good quality stock. Sales of Euro 6 light commercial vehicles increased to just under 50% of the overall total in July, with the number of different online buyers increasing as well. Supporting this enthusiasm is data confirming average prices across all ages and sectors have risen 39.0% versus July last year.

July in detail

The average age of sold stock in July rose from 64.8 months in June to 69.5 months. This figure was 3.4 months lower than the same point last year.

Average first-time conversion rates stand at an extraordinary 92.3%, up from 86.5% in June and up from 76.7% 12 months ago.

Average mileage for sold vehicles stands at 71,878 miles, an increase of 2,226 miles on June but nearly 8,500 miles less than July 2019.

Glass’s continues to monitor the LCV market closely and has an open dialogue with auction houses and manufacturers, leasing and rental companies, independent traders and dealers as well as the main industry bodies. This information, combined with the wealth of knowledge in our CV team ensures Glass’s valuations remain relevant in the market place.

A golden age for used-car markets?

As the automotive industry starts its recovery following the coronavirus (COVID-19) lockdowns, there is a notion of unexpected recovery visible in some markets. Is this pointing towards a golden age for used-car markets? Christof Engelskirchen, Autovista Group’s chief economist, talks with Anne Lange, head of data science, and Markus Halonen, head of research, statistics & data analysis at Autovista Group, about signs of recovery and the root causes for different market reactions in the used-car market at this time.

Christof: Are we in a phase of the market, where the trends that we see can already be safely interpreted or is it is more affected by external events? I am referring to the massive incentive scheme in France, also for used-car buying, which has pushed RVs up. I am also referring to the weak-British-pound- and supply-shortage-induced lack of new and used cars on the market that meets pent-up demand and lifts prices?

Anne: There are certainly some anomalies affecting current used-car price trends. For example, the French incentive scheme, that subsidises used-car buying and drives RVs up and the UK’s shortage of supply of new and used cars, that also drives RVs up.

There is one emerging trend that may last longer: people may exhibit a financial cautiousness and rather turn to a used-car than a new-car. The lack of available new cars further compounds this. In addition, those that used to rely on public transport may opt for some budget alternatives, thus driving up demand for older used-cars.

Markus: The reason for the decreasing active stock (number of active adverts) is simply that dealers are selling more cars than they are buying in. For example, in Finland and Sweden, the used-car selling volume has been at a high level lately. In June this year, used-car retail sales volumes were higher than in June 2019. High sales but lower than normal inflow of used cars keeps the stock falling. We have some anomalies, like the French used-car incentive scheme, pushing RVs up. Still, even in those countries where schemes are different or non-existent, there are commonalities: used-car sales volume is at a good level, stock is decreasing and prices are increasing. On top of what Anne said, a reason for the currently good demand for used cars is that people are spending less money on vacation and spent less during the lockdown. Patterns of consumption have changed, at least temporarily. Used-car markets are seeing the benefits.

Christof: People ask you many questions around our methodology for publishing used-car price development. How sensitive is our methodology to outliers? How do we control for irregular market conditions? What is the lag in our published values, i.e. how quickly are we capturing trends that may emerge?

Markus: Our methodology is based on market observation data that we source from various portals all across Europe on a daily basis. We control for outliers, data errors and non-actively managed cars. This works reliably.

I am not sure what the background is on the question of controlling irregular market conditions. Irregular market conditions like the COVID-19 pandemic affect used-car prices and that is what we are capturing with our data models. For measurement accuracy, we have implemented rolling values, where past days’ trends are captured as well as the current day’s realities. We put more weight on recent values in the statistical models. There is only a very small lag in how fast we see emerging trends, much smaller than for any economic modelling.

The full interview can be read here. In it, Lange and Halonen discuss the trends emerging for old and young used-cars across Europe, and whether dealer activity has picked up following COVID-19 lockdowns. Their answers are backed up by data showing the emerging patterns of used-car prices and stock levels in the market.

New Car Market Update August 2020

At last there is some positivity to report in the new car market, with July registrations recording the first increase of the year. Registrations came in at 174,887, which represents an 11.3% rise on the same month last year, according to figures released by the SMMT. This was the strongest July performance since 2016.

Although fleet registrations accounted for the lion’s share of the market (52.5%), it was private registrations that demonstrated the most growth, with a 20.4% increase. Dealers being open for business for the whole month of July will have helped fulfil the pre-order backlog caused by the COVID-19 lockdown, together with improvements in the supply chain. There is also some pent-up demand generated by consumers who managed to save throughout lockdown, and are taking advantage of some competitive offers and incentives from manufacturers and dealers.

Private new car registrations monthly graph August 2020

Data courtesy of SMMT

Growth was weaker in the fleet sector, with a 5.2% improvement on this time last year to 91,857 units, as both longer term and short cycle business struggles to pick up. At the same time, coronavirus uncertainty continues to hamper business expenditure decision making, and working practices for their employees, which may affect leasing deals going forward.  Although, if there is continued improvement in the economy, back to something like pre-lockdown levels, then expect to see a strong new car order book as confidence improves and lease deals currently being extended end.

New car market sector split YTD graph August 2020

Alternative fuel cars (AFVs) are still gaining market share at a fast pace, with battery electric vehicles (BEVs) up 259.4% and Plug-in hybrids (PHEV) gaining 320.3% compared to July last year. BEVs now make up nearly 5% of this year’s total new car registrations compared to only 1.4% last year, while all other AFVs are also increasing market share, albeit to a slightly lesser extent.

The best sellers list has returned to some sort of normality this month, with small to medium sized cars filling the majority of the top ten as deliveries get back up to speed. The Vauxhall Corsa, Ford Fiesta and Ford Focus fill the top three places respectively. Volkswagen has three entrants, the Golf, Polo and Tiguan. The Mercedes A-Class, the Nissan Qashqai, Ford Kuga and MINI also feature.

August is usually a quiet month for new registrations with summer holidays in full swing, but with getaways curtailed this year, a similar monthly registration increase could be possible and would be beneficial but not crucial to the industry. The acid test will be the September 70-plate change. This is ordinarily the second most important month of the year and therefore a healthy increase in registrations would certainly go some way to keep the recovery on track.

Used Car Market Update – July 2020

Auction Wholesale Market

It is fair to say that the UK used car auction market recovered quicker than many expected. All the key metrics – first time conversion rate, sale value and sale volume – climbed rapidly with no signs of letting up at the end of the month.

Used car market conversion rate graph July 2020

These key measures are virtually back to pre-lockdown levels. However, while it is tempting to take a bullish view of the market for the next few months a degree of caution is advisable as it is likely there will be some “over-recovery”, especially for sale values.

Used car market sales volume index July 2020

The possibility of further lockdowns is looming ever larger and whilst they are likely to be regional, they will clearly be centred on those areas of higher population density. They will not only affect used car activity in those areas but are likely to temper the enthusiasm of buyers across the country.

Clearly, July will give a better indication of the level of sustainability for the used car wholesale market. Early indications are that the auctions are showing similar performance to June, and Glass’s editorial team will continue to monitor them through the month.

Used Car Retail Market

Naturally, the recovery of the used car wholesale market has been driven by the recovery of the used car retail market. Whilst it has only been reopened a matter of weeks, the number of sale observations and the average sale price have not only recovered, but are exceeding pre-lockdown levels. To a degree this may be down to the pent up demand resulting from three months of lockdown, but it is still encouraging to see the rate of recovery. Like the used wholesale market, a degree of caution is appropriate when planning for the next few months.

Used car market average sale price graph July 2020

Glass’s Live Retail Pricing tool also reports on the average time a car spends on the forecourt, and given retail sites have only reopened relatively recently it is no surprise that June’s average of 81.9 days is twice the usual figure. This figure will undoubtedly improve in July, although it probably will not return to “normal” levels until August.

Used car market average days to sell graph July 2020

Next Month

Early indications are that June’s healthy recovery of both the wholesale and retail used car markets has continued into July. Should the easing of travel and trade restrictions continue – not just in England but especially for the rest of the United Kingdom – then it is reasonable to expect the improvements to continue for the rest of the month. Localised lockdowns are a distinct possibility. However, depending on the areas affected and the lockdown duration, they may impact this recovery. The country is clearly are not out of the woods yet, but the current signs across the industry are very positive.

New Car Market Update July 2020

There were some green shoots of recovery in the new car market in June as the Government imposed lockdown lifted for dealerships in England, though not all were open throughout June as new social distancing measures needed implementing. Whereas in Scotland, Wales and Northern Ireland closures were still in place.

This resulted in 145,377 new car registrations in June according to figures published by the Society of Motor Manufacturers and Traders (SMMT), down 34.9% compared to the same month last year. This equates to the market being almost 616,000 units, or 48.5% behind the same period last year.

The private retail sector saw a stronger recovery than fleet or business, with registrations 19.2% lower in June, with pre-lockdown orders now being fulfilled more readily. While fleet registrations contracted by 45.2% to 69,498 units.

Private new car registrations monthly graph July 2020
Data courtesy of SMMT

Once again Alternative Fuel Vehicles (AFVs) outperformed traditional fuel types, with a 73.3% increase on June last year, which included a massive 261.8% increase in Battery Electric Vehicles. Petrol fell almost 40%, while diesel continues its rapid decline with a fall of 59.3%, now languishing in third place behind petrol and AFVs in total registration terms. The year to date totals of petrol and diesel registrations are significantly behind last year, as shown in the chart below.

New car market Fuel split YTD graph July 2020
Data courtesy of SMMT

June’s figures show limited improvement on the previous two months registrations, but the uneven nature of the reopening of dealerships throughout the United Kingdom makes it difficult to measure the extent of any pent-up demand and consumer confidence. Consumers are still uncertain about their financial situation and what the future holds, so may be reticent to commit to long term and large financial commitments. There is also the possibility of potential customers switching from buying new to used cars to save money. This could be good news for used car residual values moving forward, yet add yet more woes to the new car market.

The same can be said for the fleet sector, as businesses come to terms with the economic shockwave of the pandemic, and look to either cut or defer spending in the near term. This will have a negative impact on registrations.

On the positive side, the Government lockdown continues to ease with more businesses allowed to open and social distancing reductions potentially improving the economic climate. The Chancellor has also brought in a number of extra spending plans to attempt to stimulate the economy and avoid a long and deep recession.